
D91 Khata - Visual Stories
A collection of data-driven infographics that serve as powerful storytelling tools for presenting complex ideas and themes on fintech, financial inclusion and innovations.
Recent Khatas
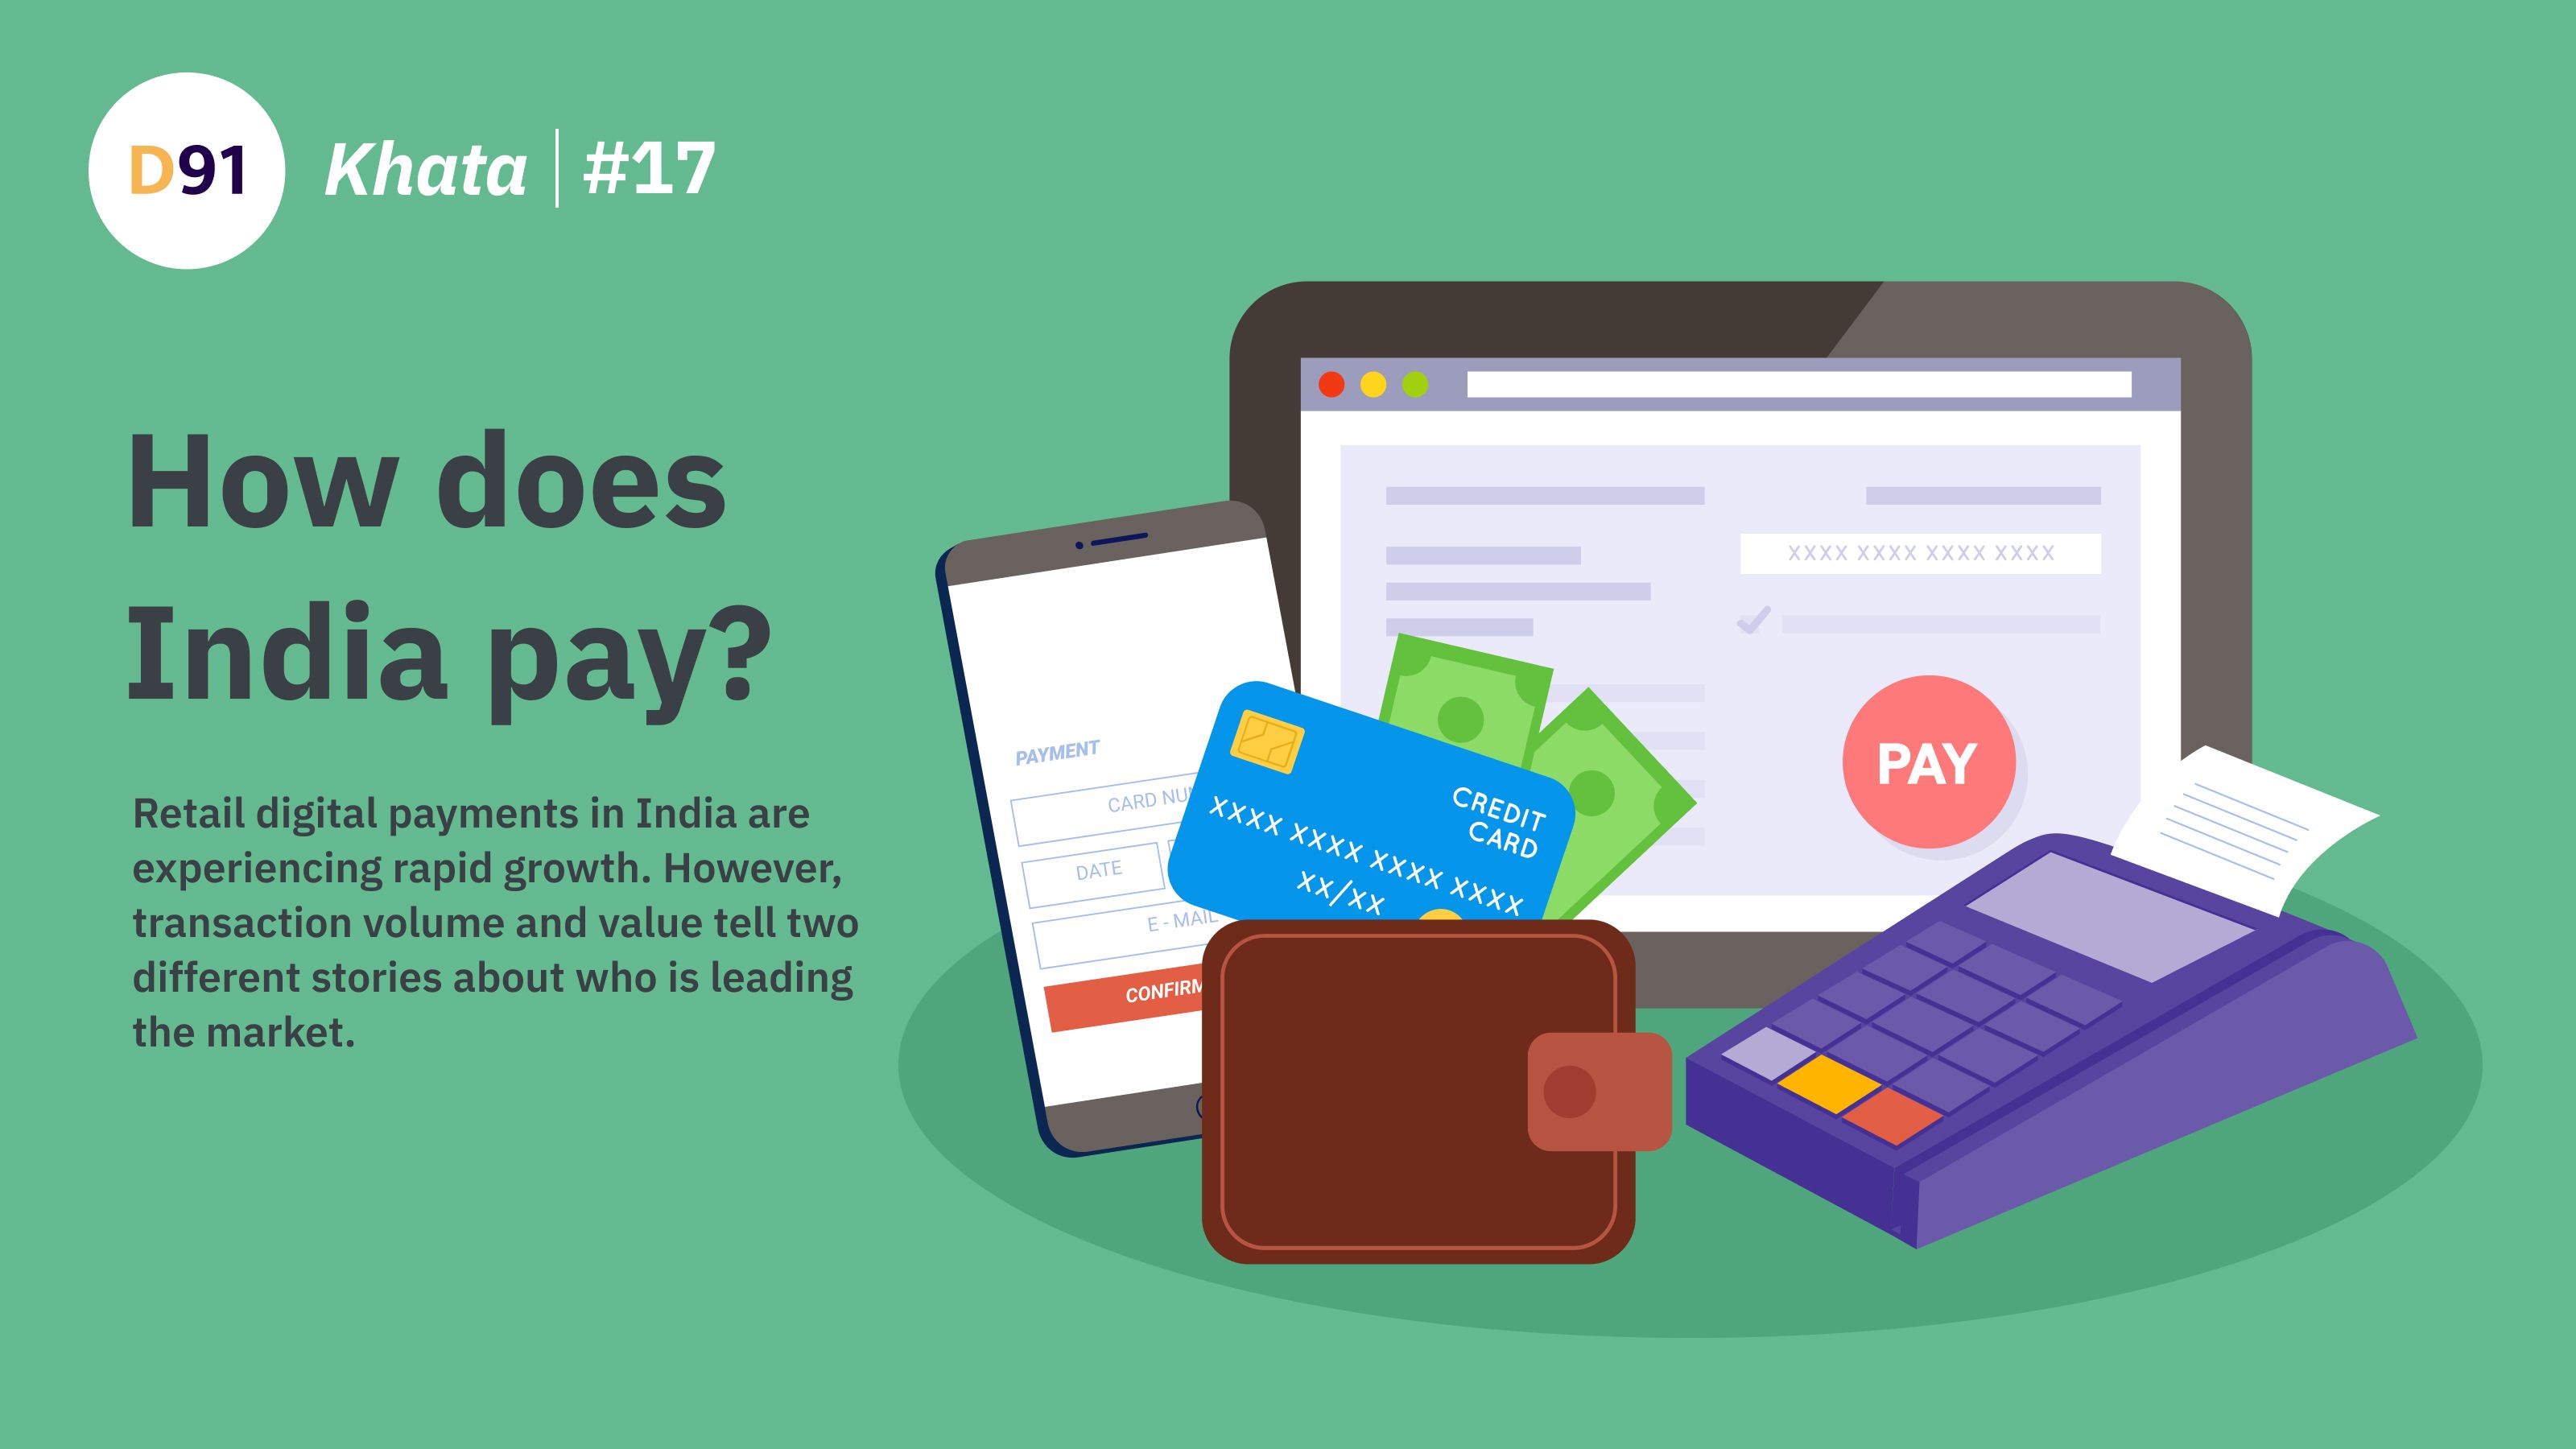
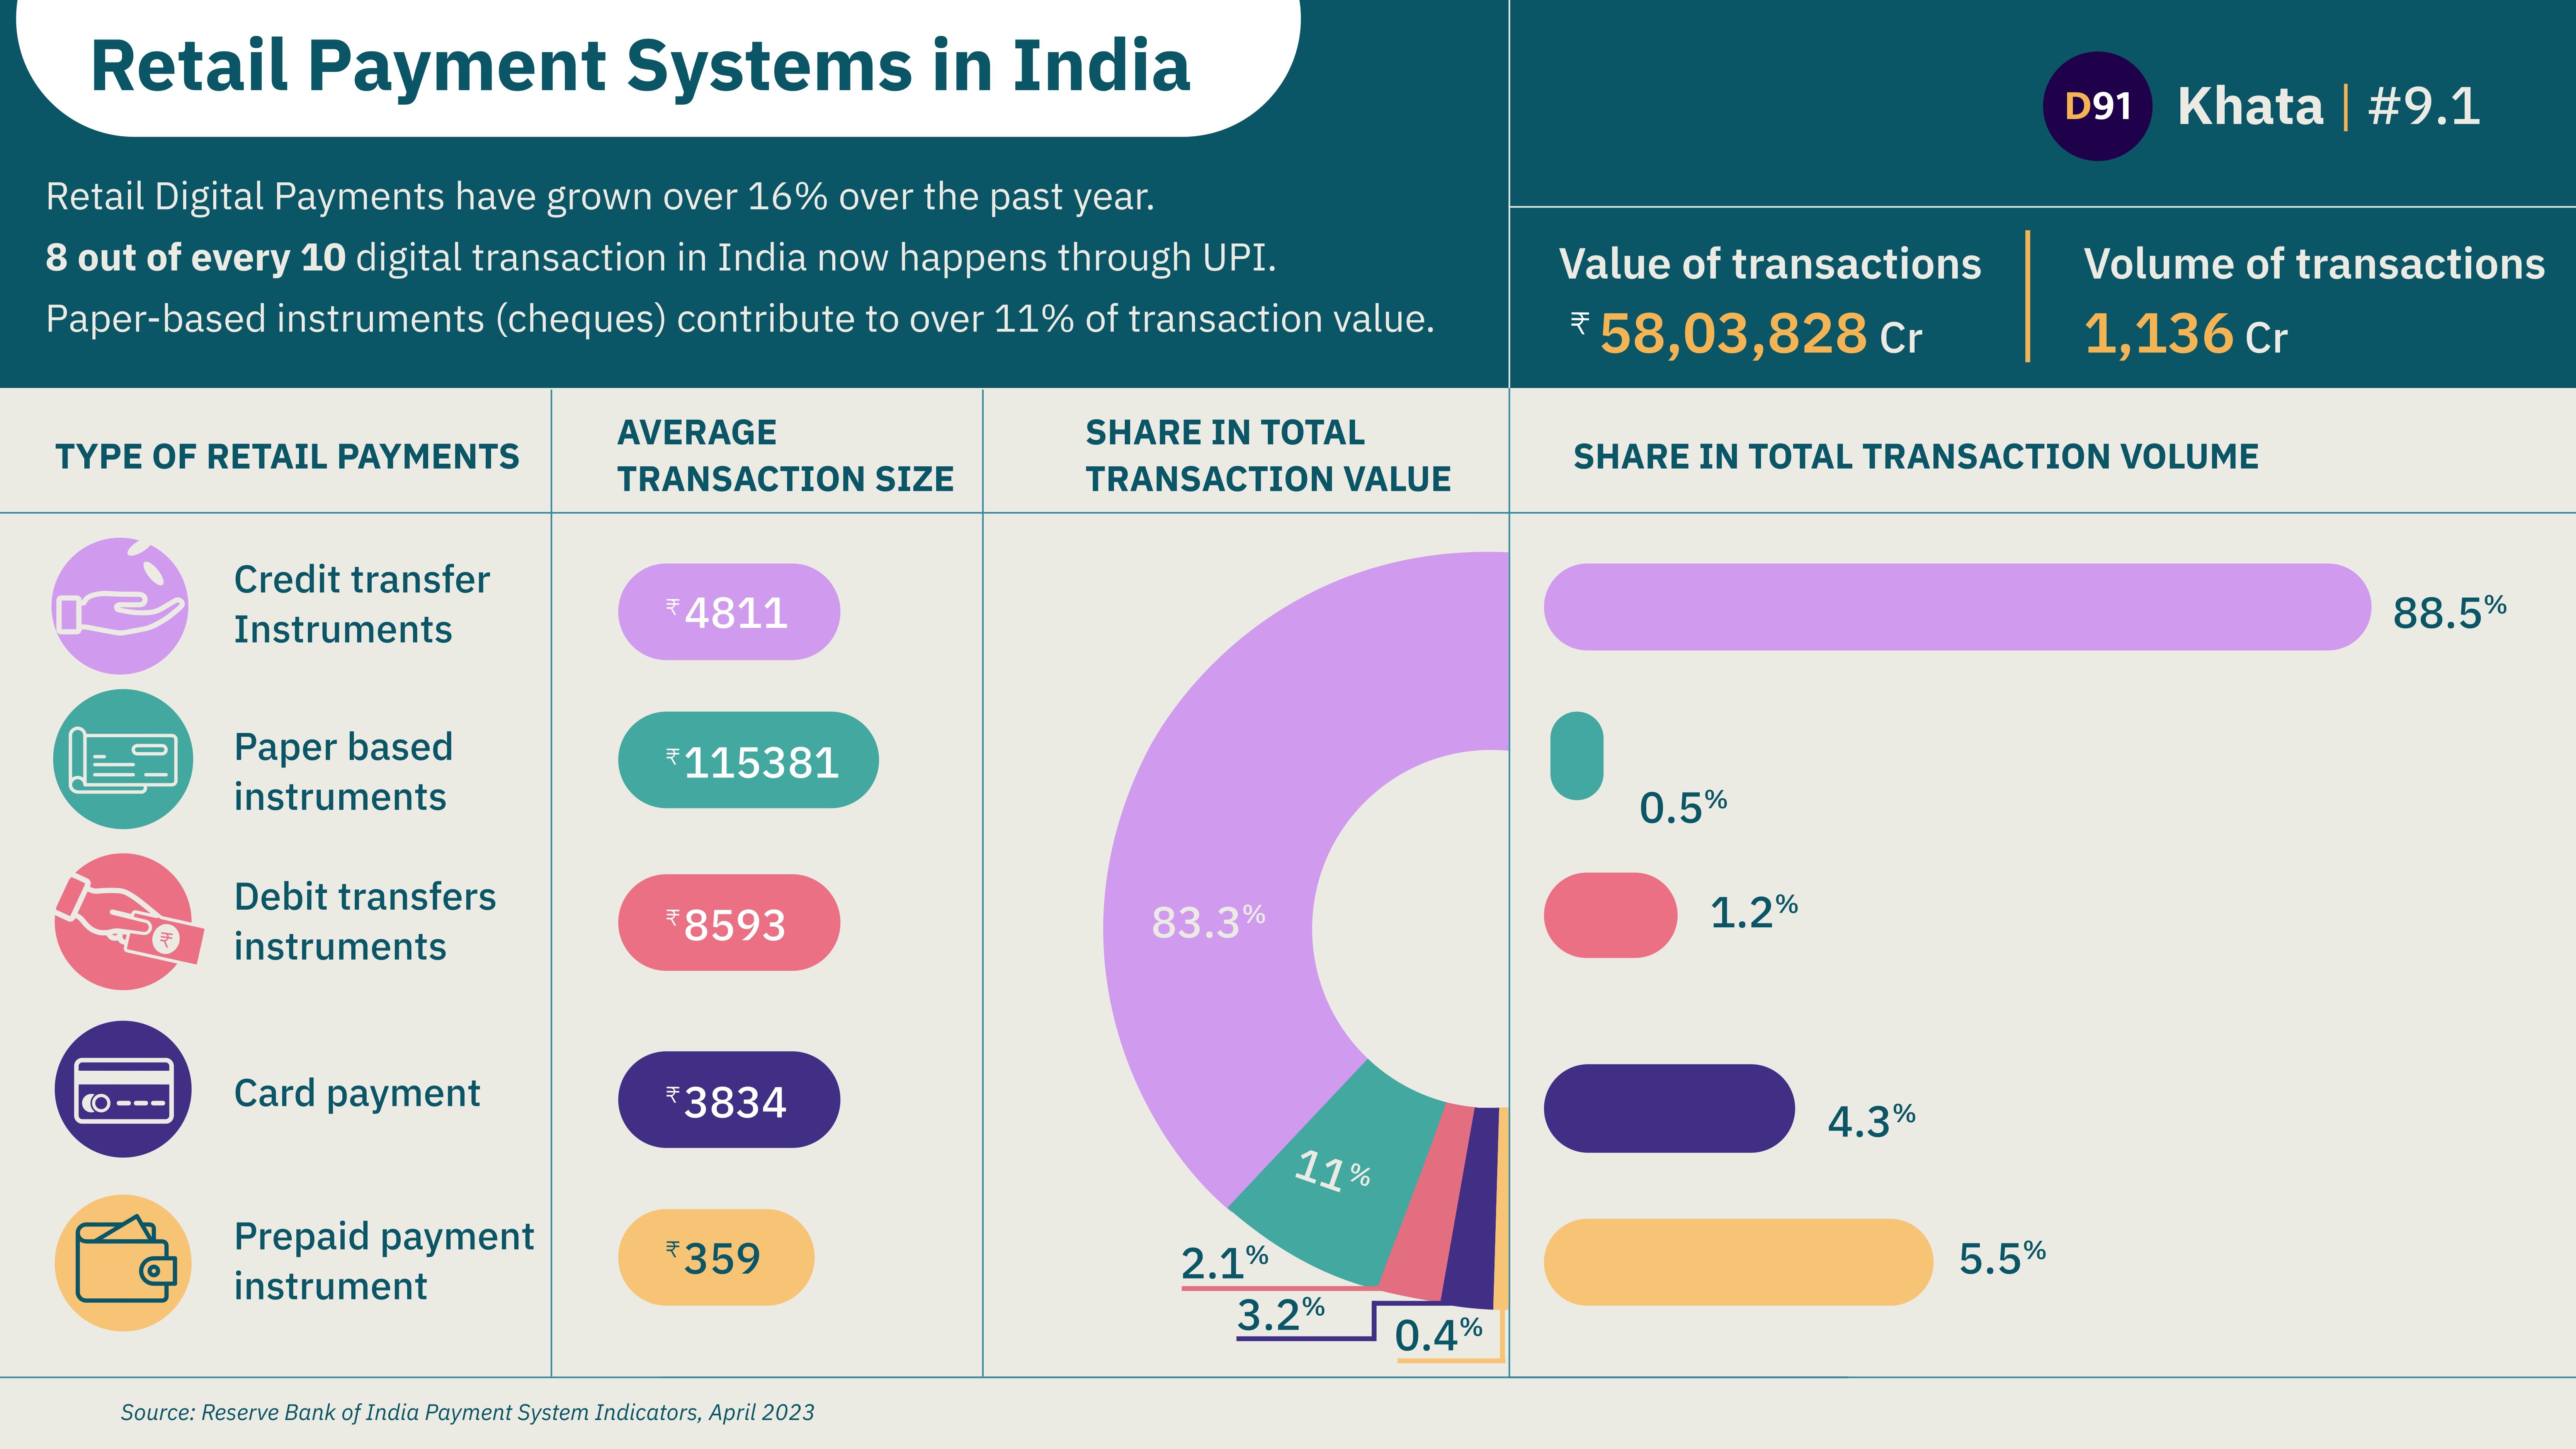
How does India Pay
Retail digital payments in India are experiencing rapid growth. However, transaction volume and value tell two different stories about who is leading the market.

Securing the Future of Finance with Post-Quantum Cryptography
As quantum computing advances, traditional cryptographic methods face obsolescence. Financial systems must adopt post-quantum cryptography to safeguard sensitive transactions and ensure resilience against emerging cyber threats.
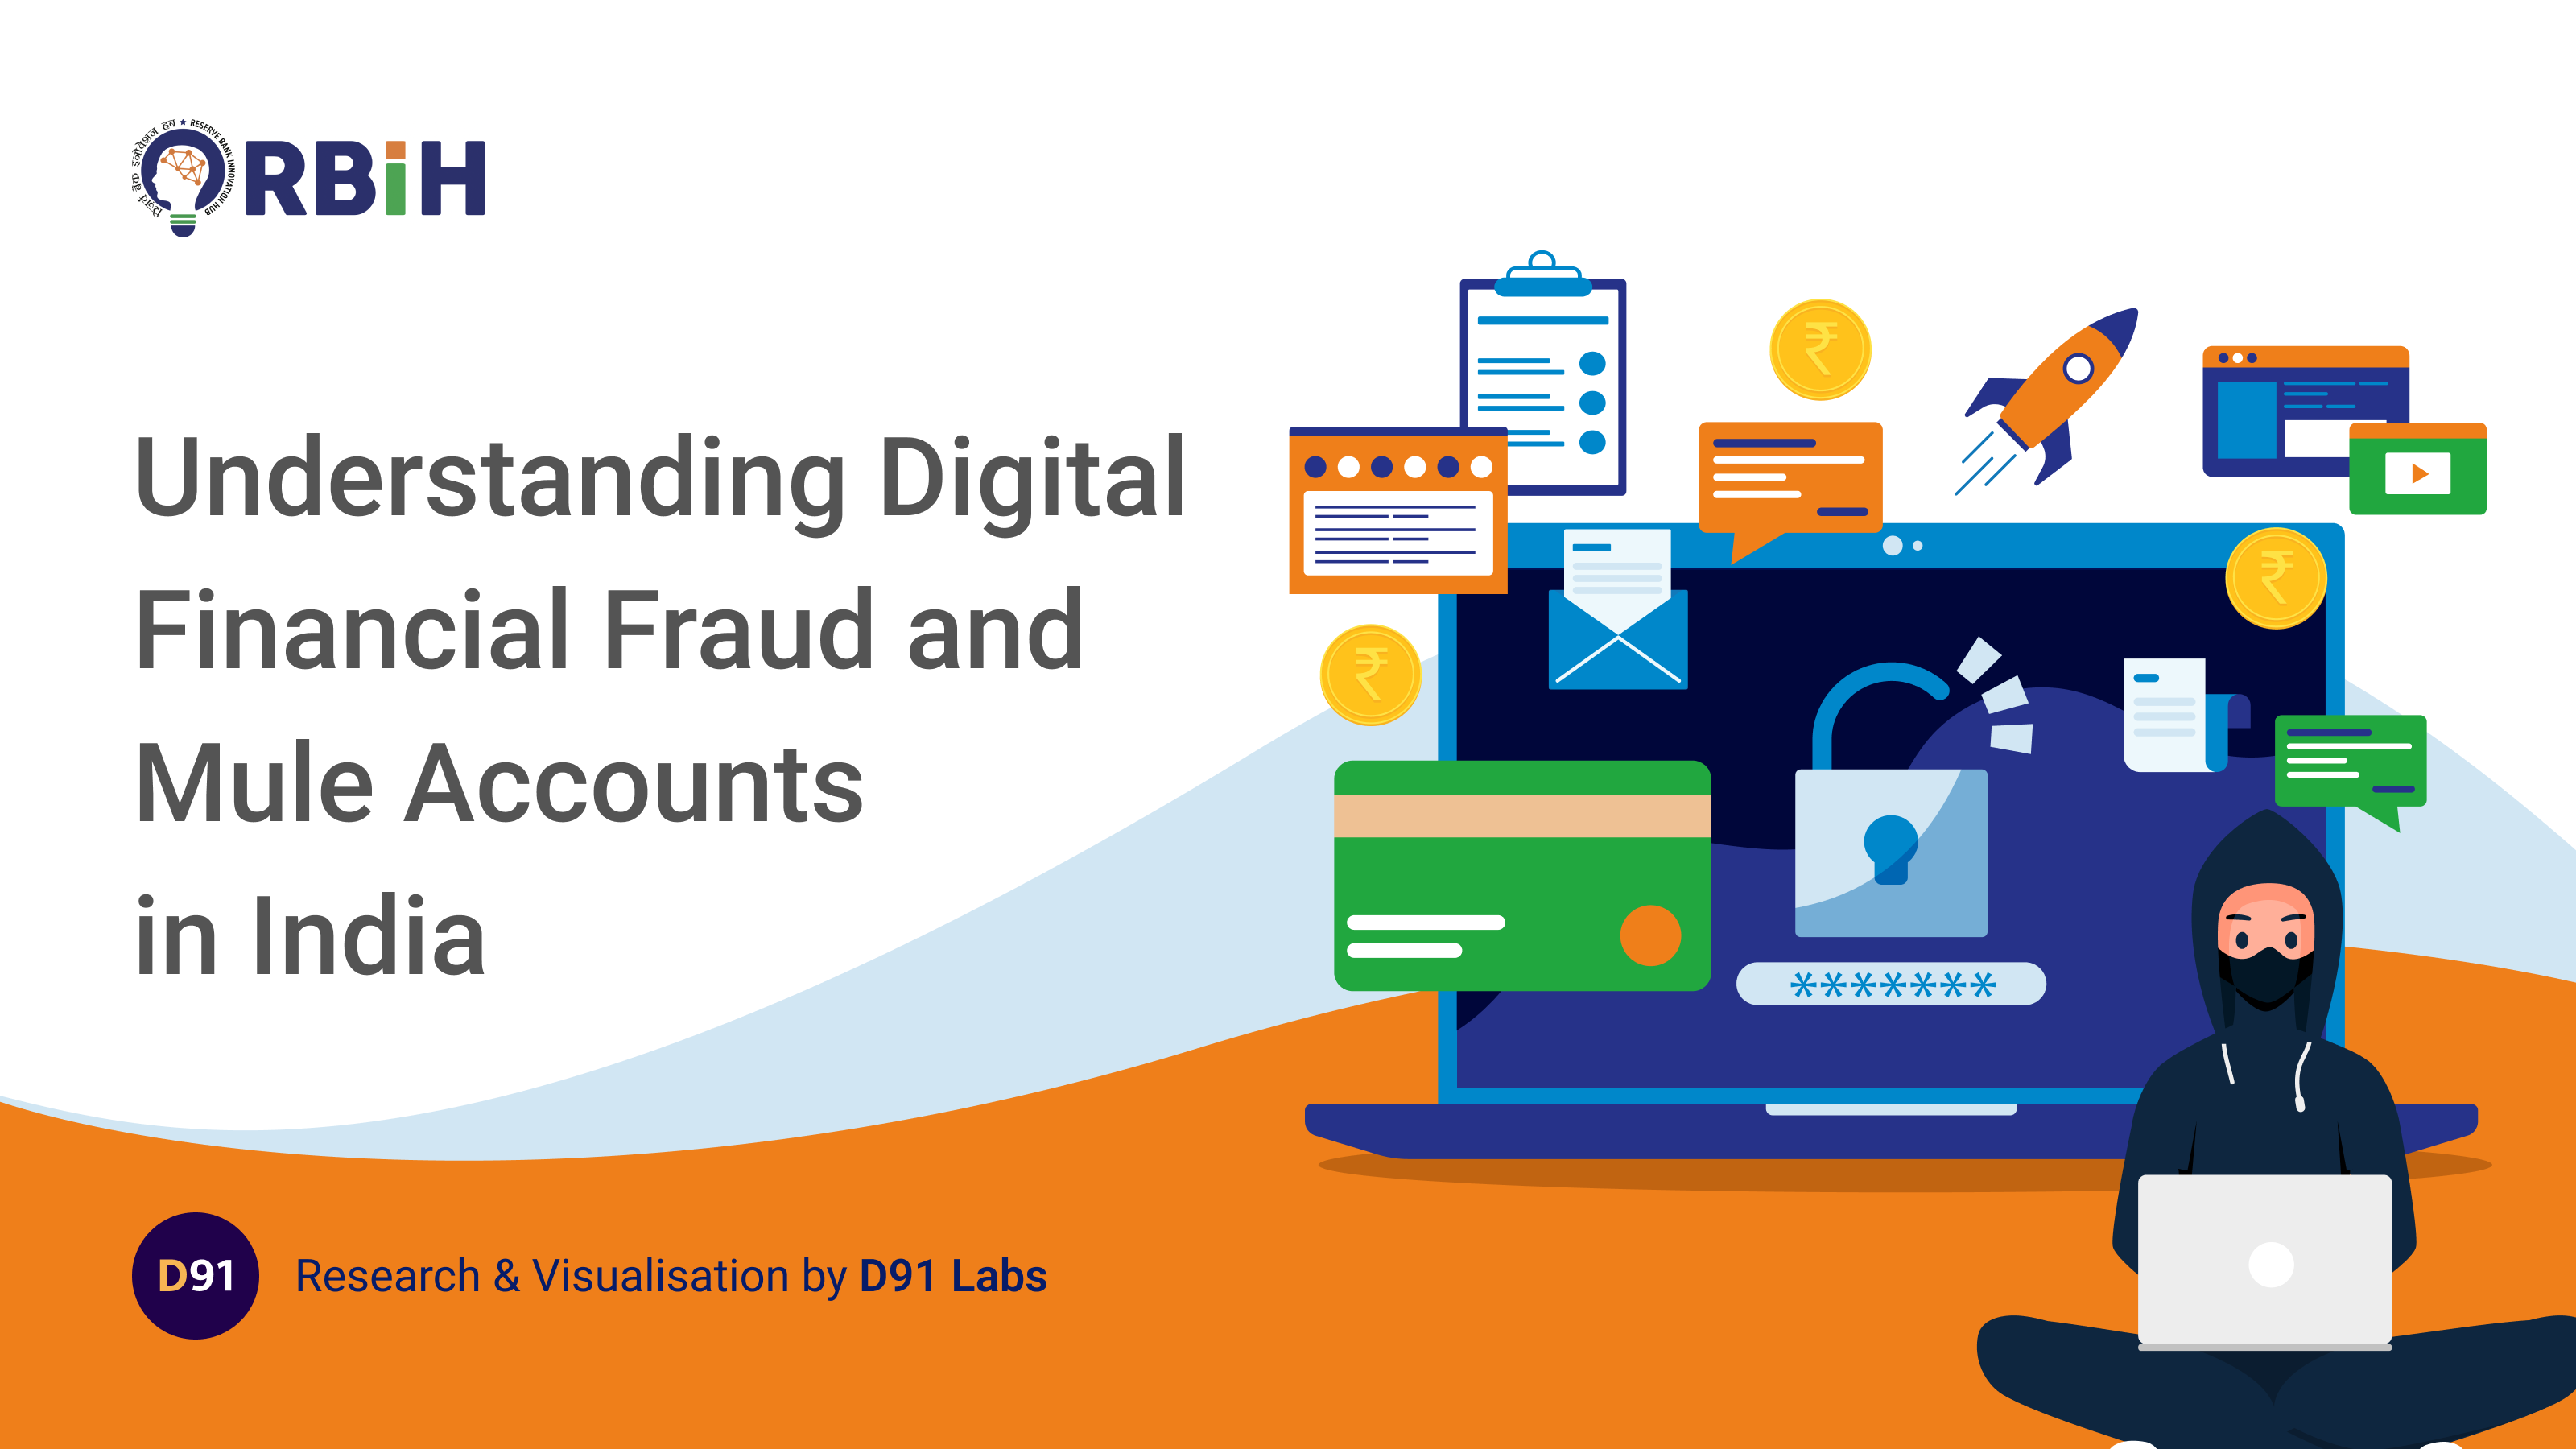
Financial Fraud and the Rise of Mule Accounts in India
India’s digital economy faces growing threats from mule accounts used in financial fraud. These accounts, often unwittingly operated by individuals, enable illicit money flows, highlighting urgent regulatory and technological challenges.
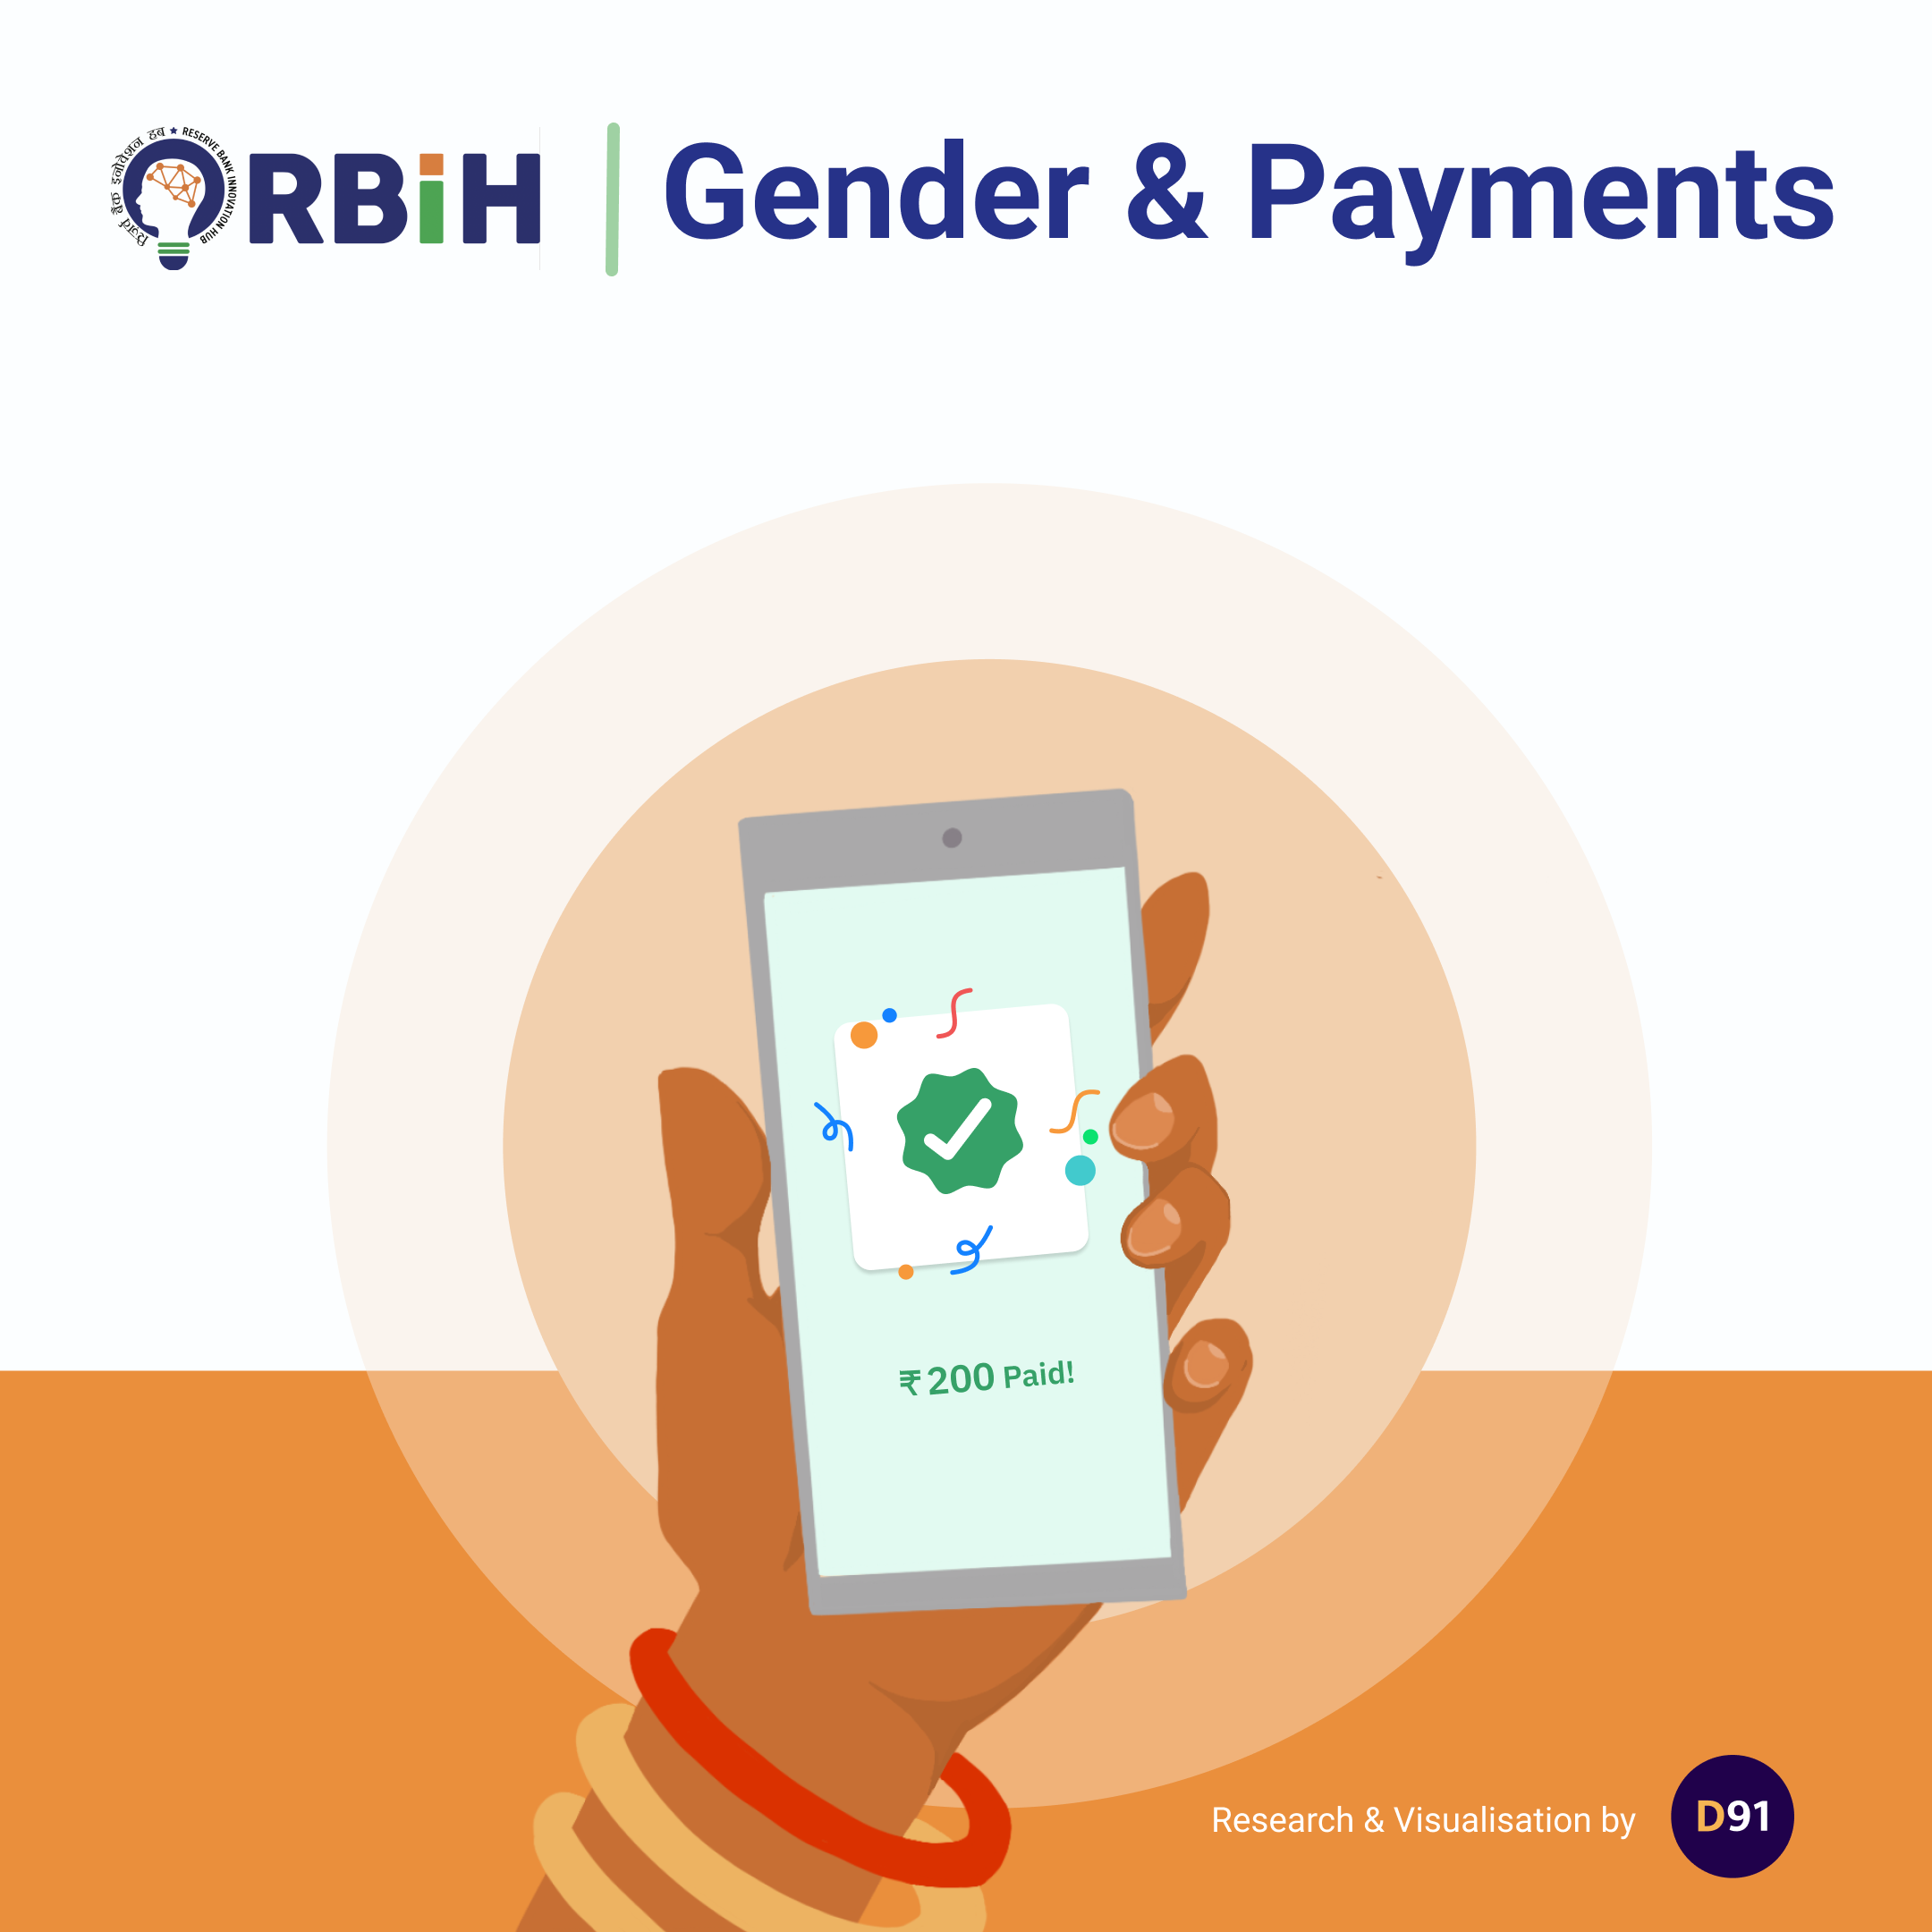
Women’s Digital Payment Behavior and Preferences in India
Women are increasingly adopting digital payments, driven by convenience and UPI's rise. However, gaps in trust, digital literacy, and device access remain key challenges to achieving widespread adoption.
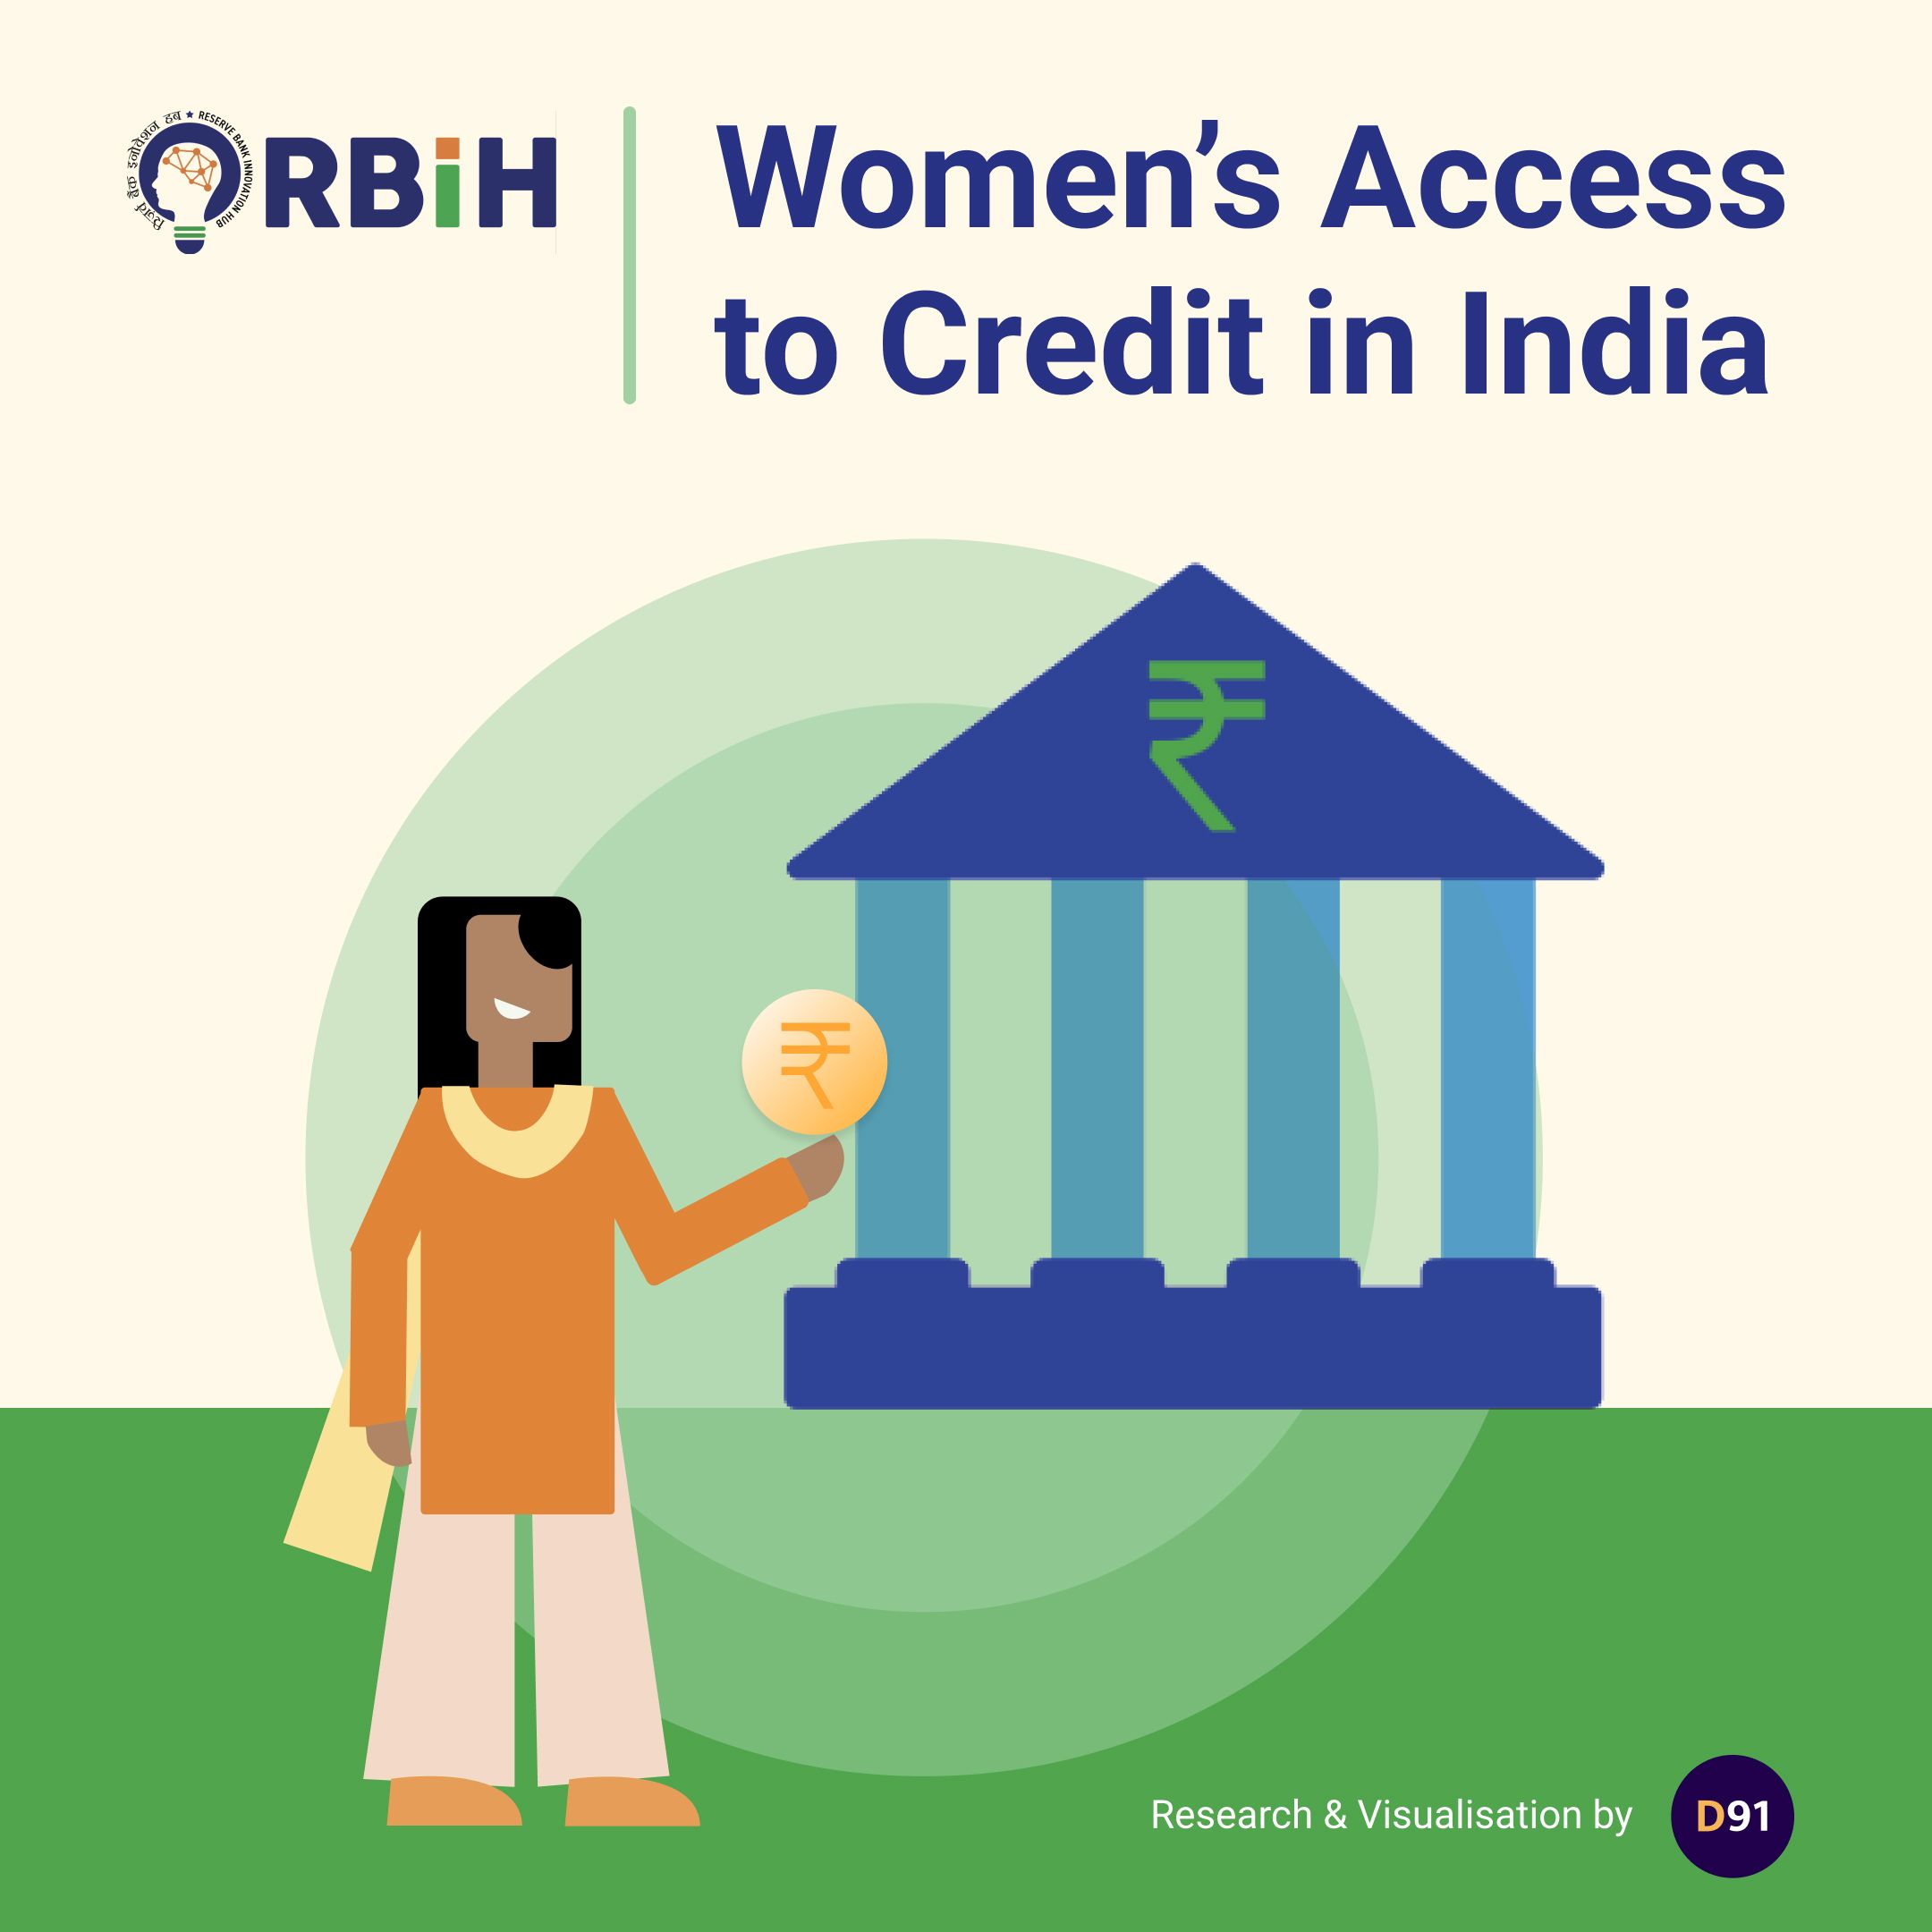
Women’s Credit Behavior and Access in India
Despite rising financial inclusion, women in India face barriers to formal credit. Thin credit profiles and limited access often push them toward informal lending, highlighting the need for innovative credit solutions.
Women’s Savings Behaviour and Preferences in India
Women’s deposits in India have grown 3.5x since 2014, with a preference for term deposits in public sector banks. Yet, rural savings lag, highlighting opportunities for financial inclusion and empowerment.
Where does India Stand on Pensions?
With India's elderly population projected to triple to 319 million by 2050, the need for a robust pension ecosystem is more urgent than ever. Bridging these gaps requires focused efforts on financial literacy, accessibility, and better product design.
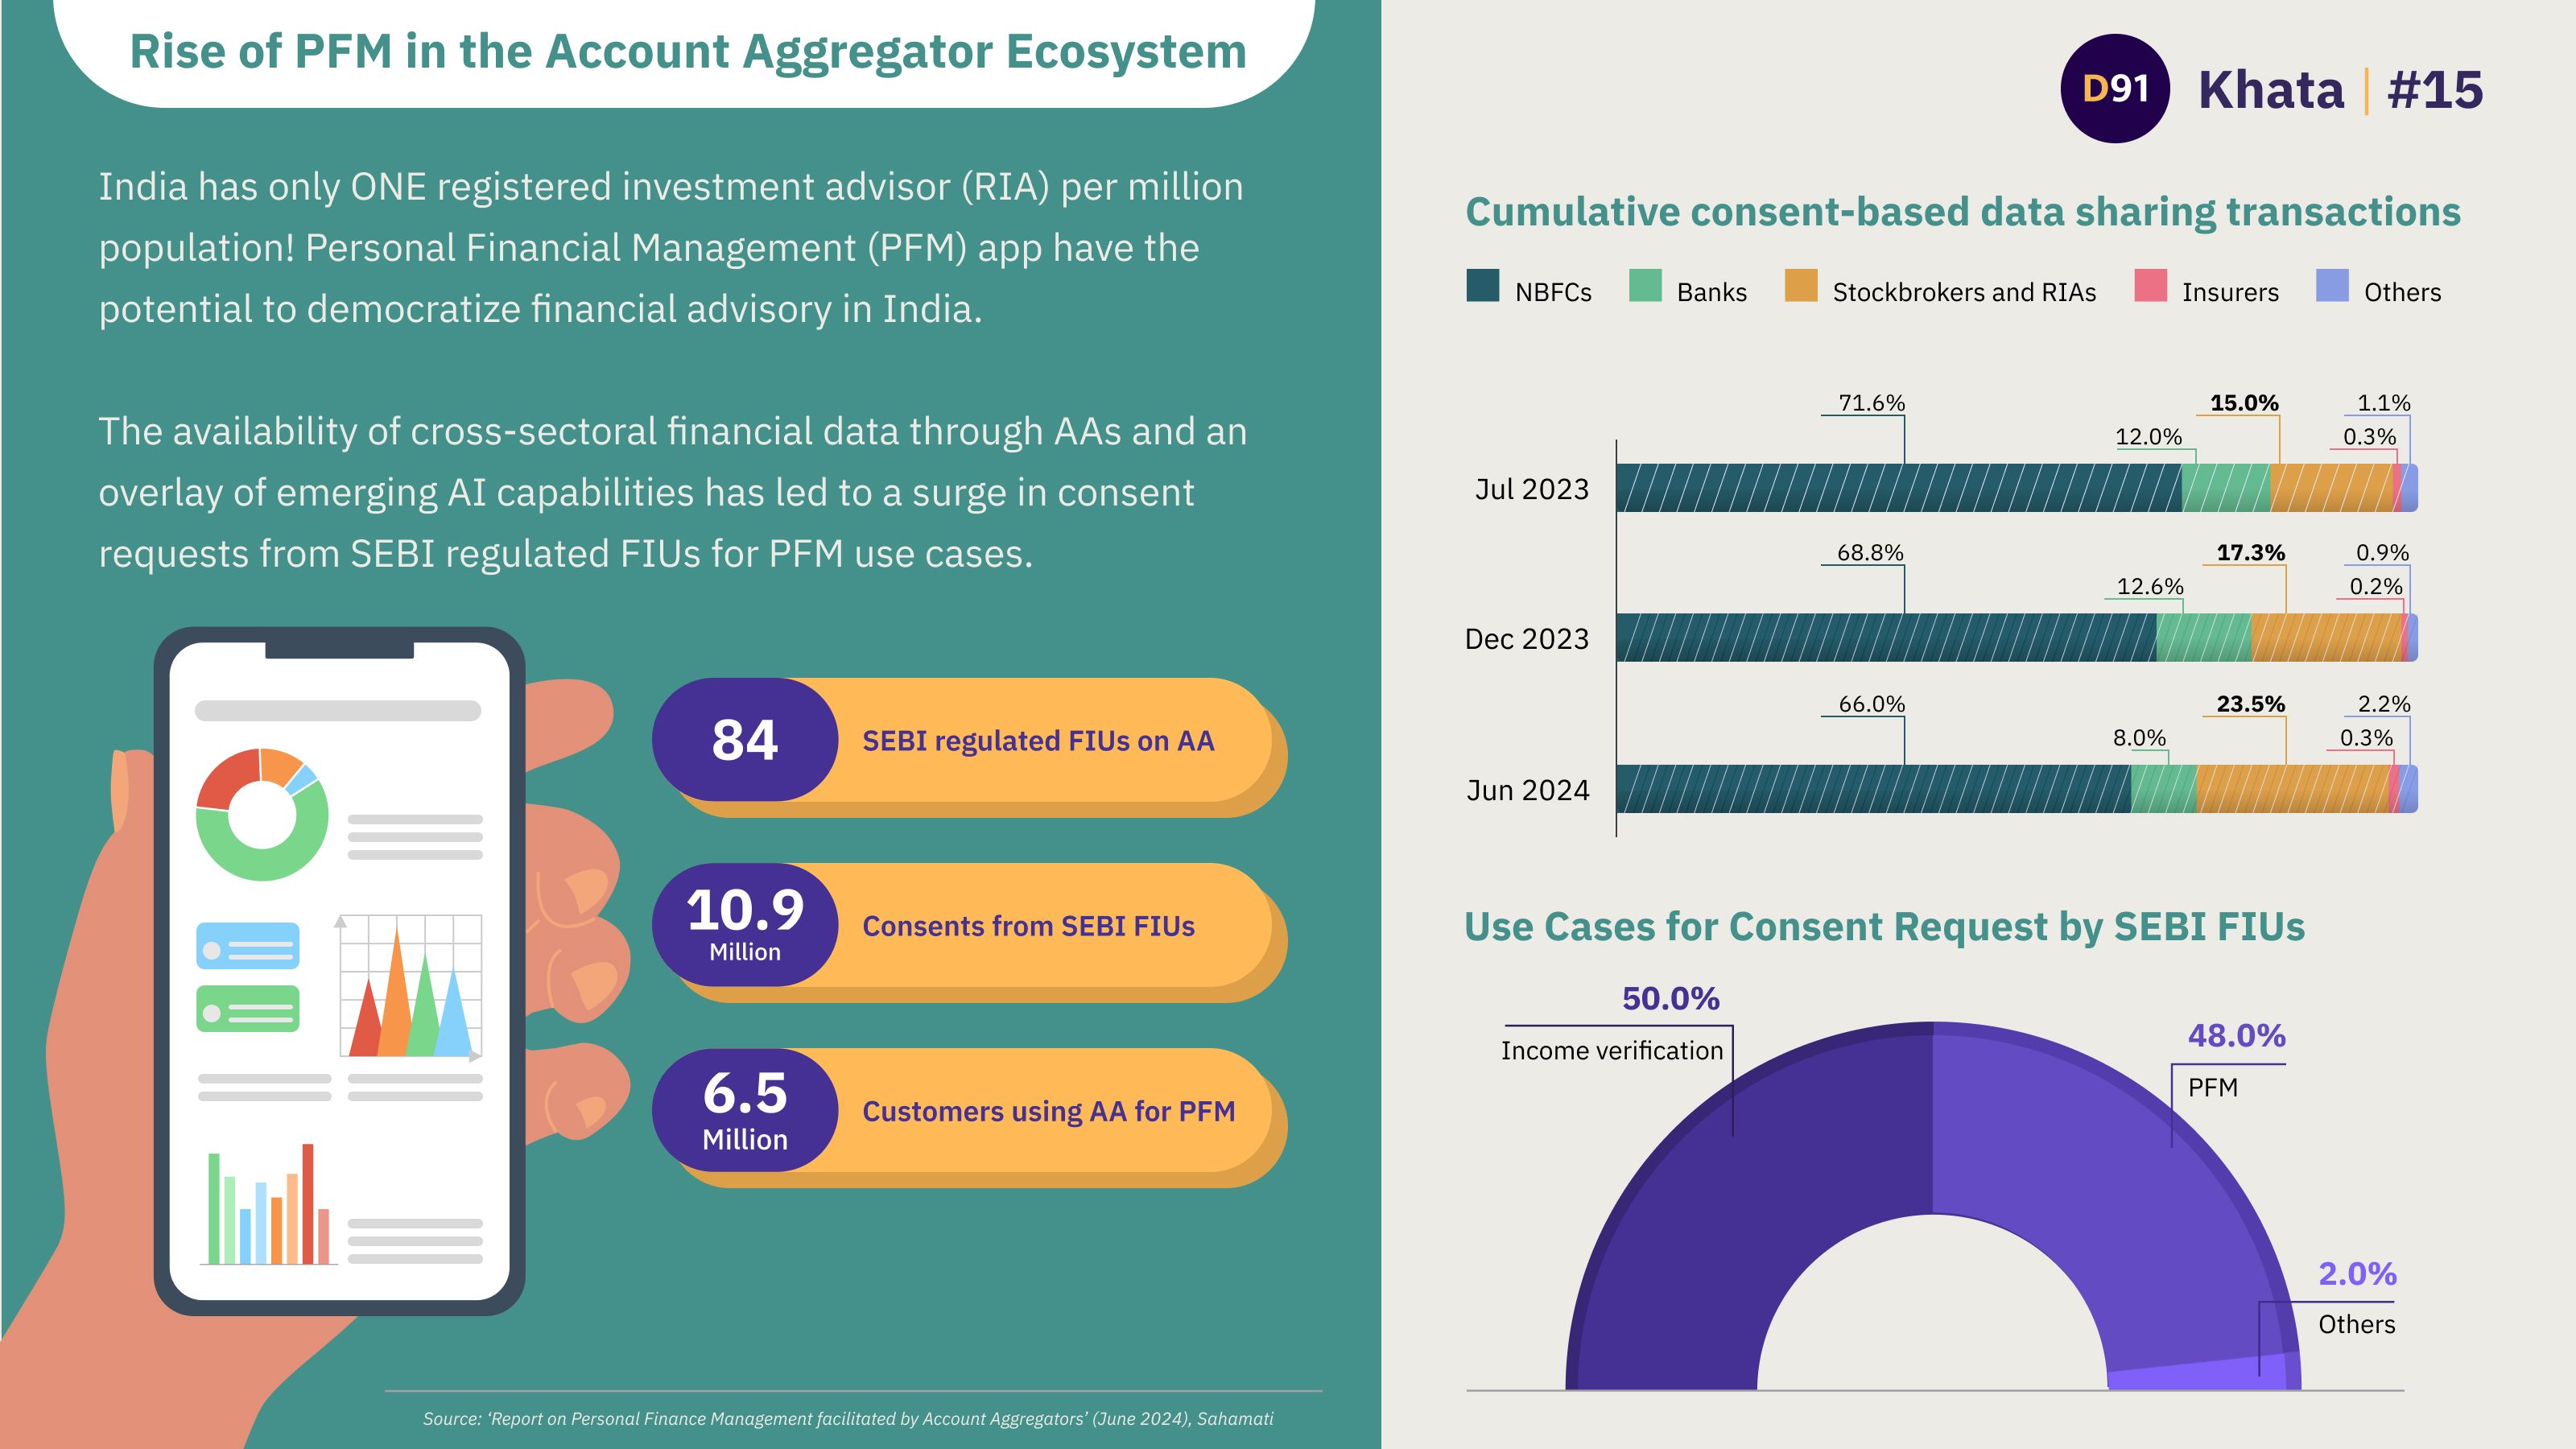
Rise of PFM in the AA Ecosystem
There is a surge in SEBI-regulated Financial Information Users (FIUs) leveraging the AA framework for PFM use cases. Traditionally, alternate and high-growth financial products in India were accessible mainly to HNIs. Account Aggregators (AAs) have the potential to democratize financial advisory by offering personalized, data-driven services to a broader audience.
How is Bharat paying its Bills?
The narrative of India's digital payments revolution often revolves around UPI in the spotlight. However, the Bharat Bill Payment System (BBPS) platform has been steadily shaping the landscape. As of December 2023, the platform has quietly approached a staggering ₹30,000 Crores in transaction value.
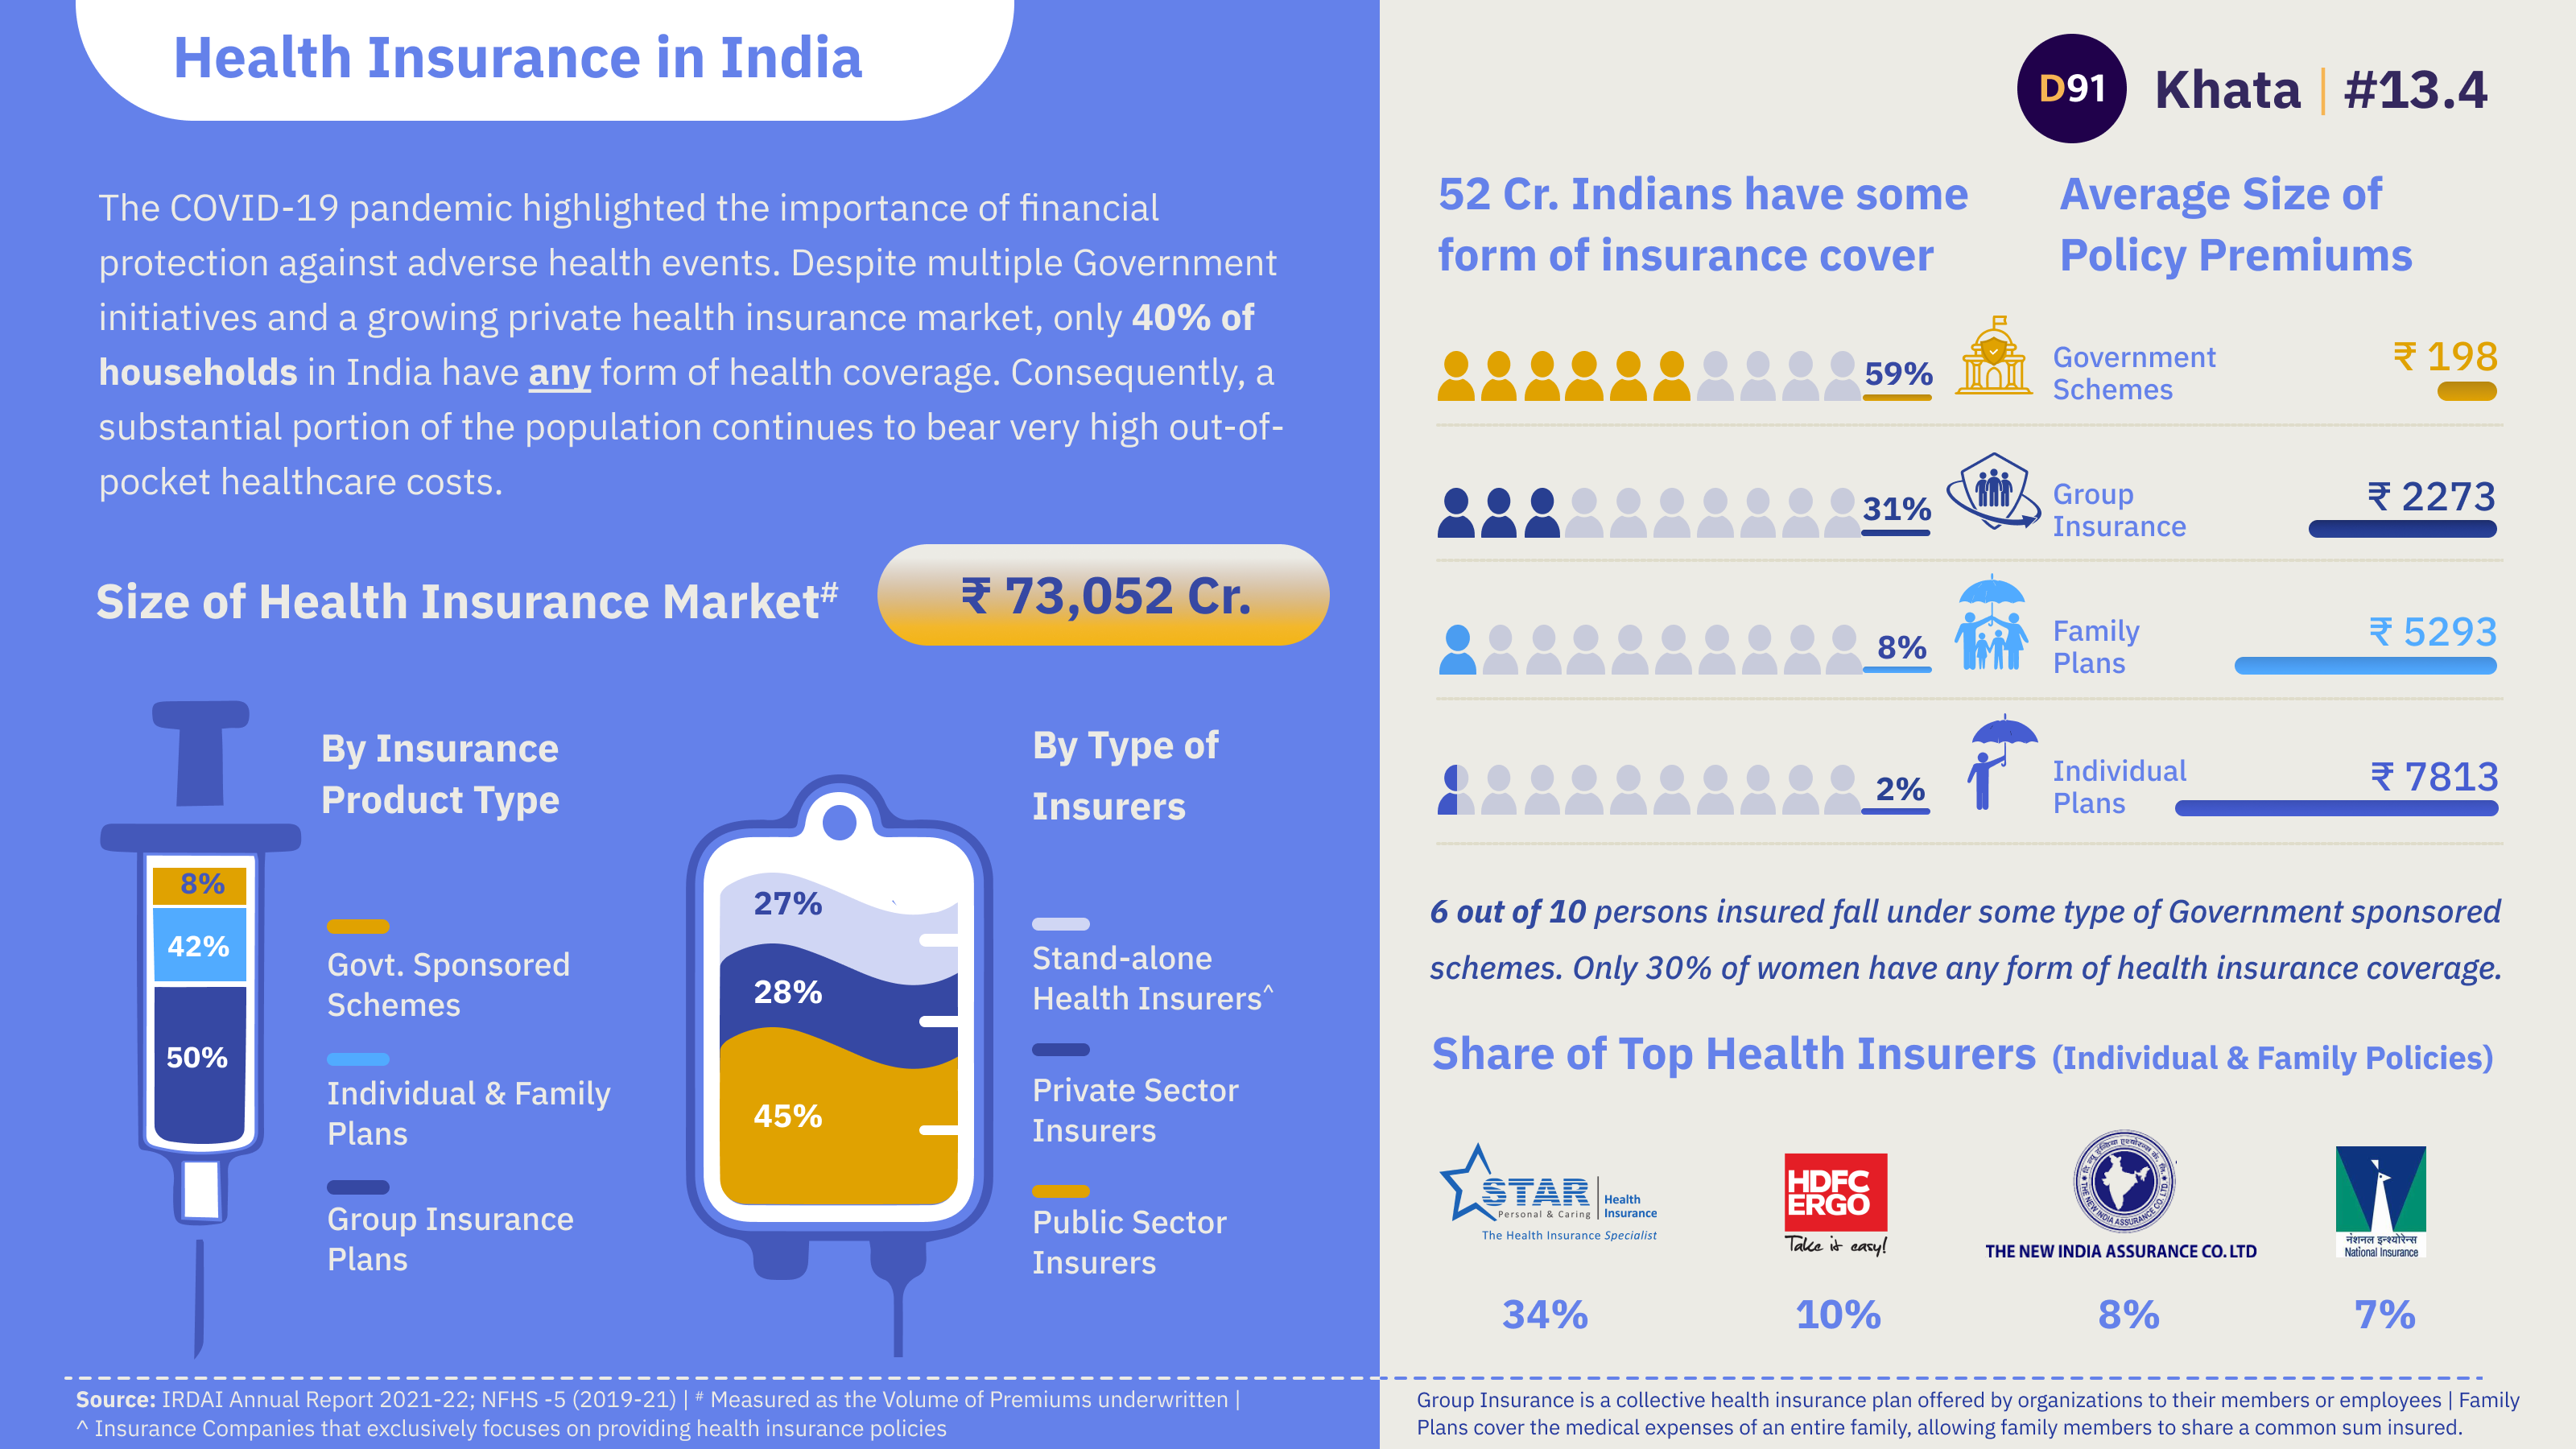
Health Insurance in India
The COVID-19 pandemic highlighted the importance of financial protection against adverse health events. Despite multiple Government initiatives and a growing private health insurance market, only 40% of households in India have any form of health coverage. Consequently, a substantial portion of the population continues to bear very high out-of-pocket healthcare costs.
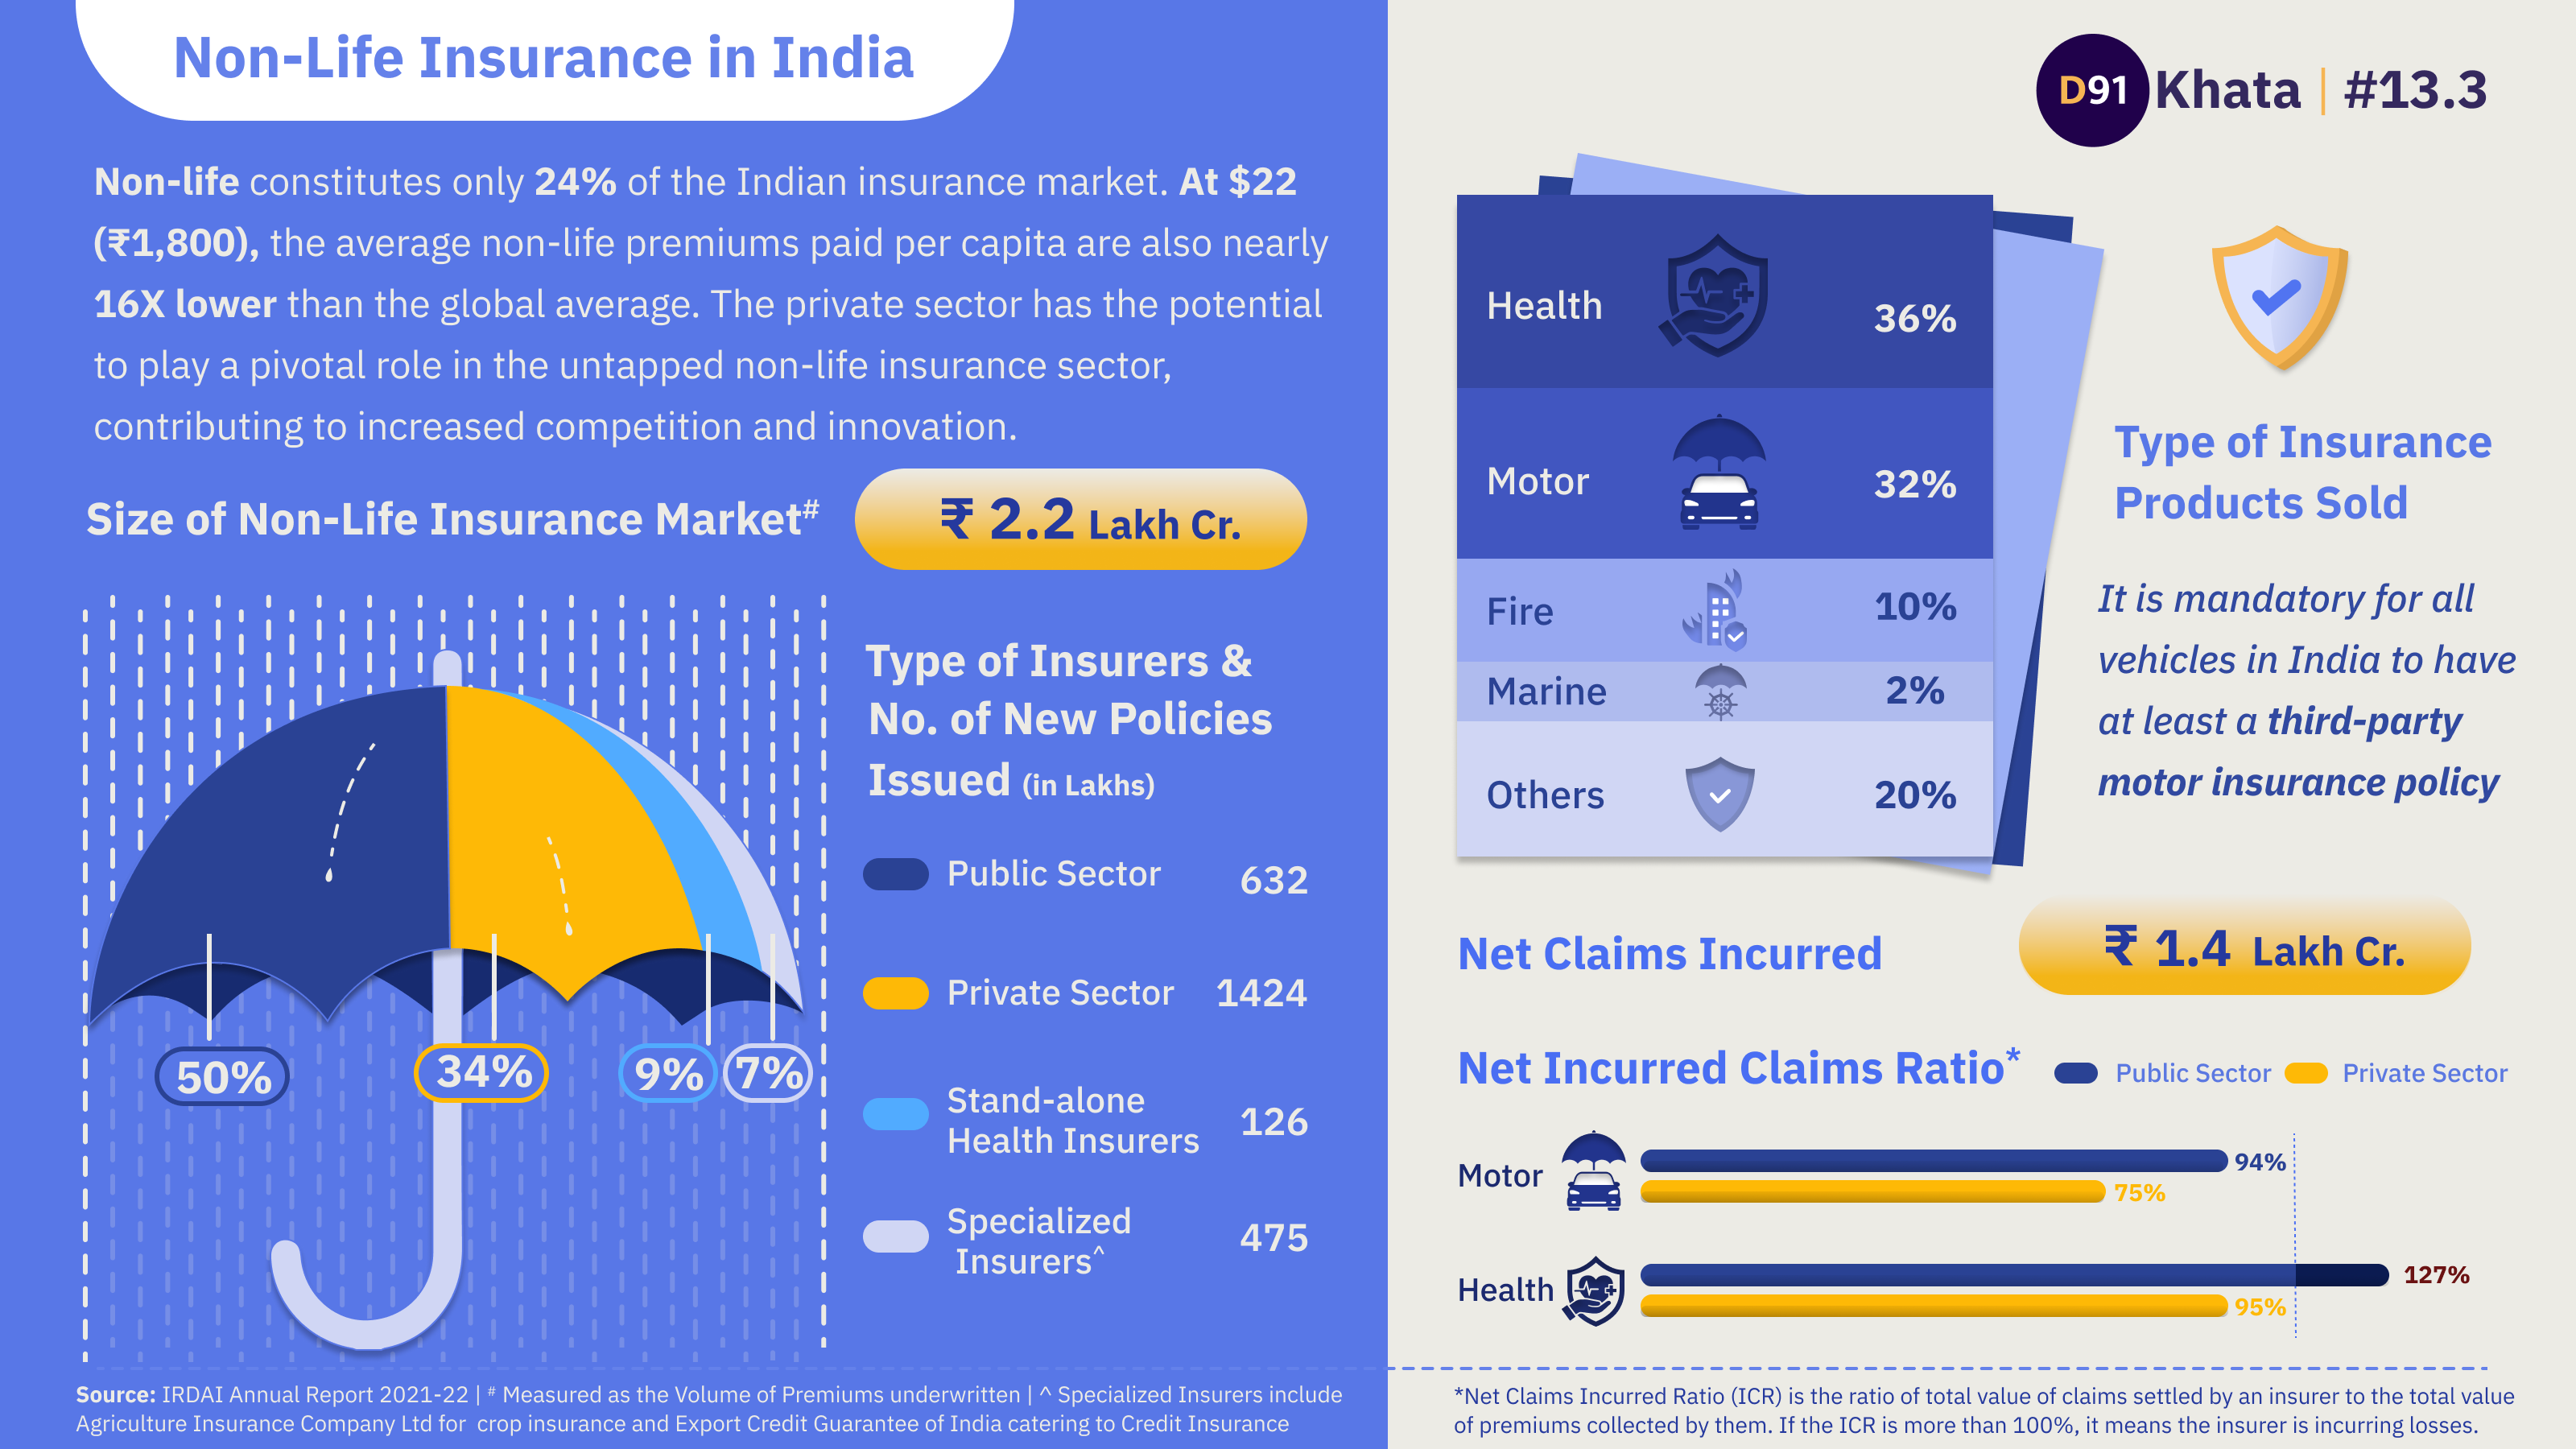
Non-Life Insurance in India
Non-life constitutes only 24% of the Indian insurance market. At $22 (₹1,800), the average non-life premiums paid per capita are also nearly 16X lower than the global average. The private sector has the potential to play a pivotal role in the untapped non-life insurance sector, contributing to increased competition and innovation.
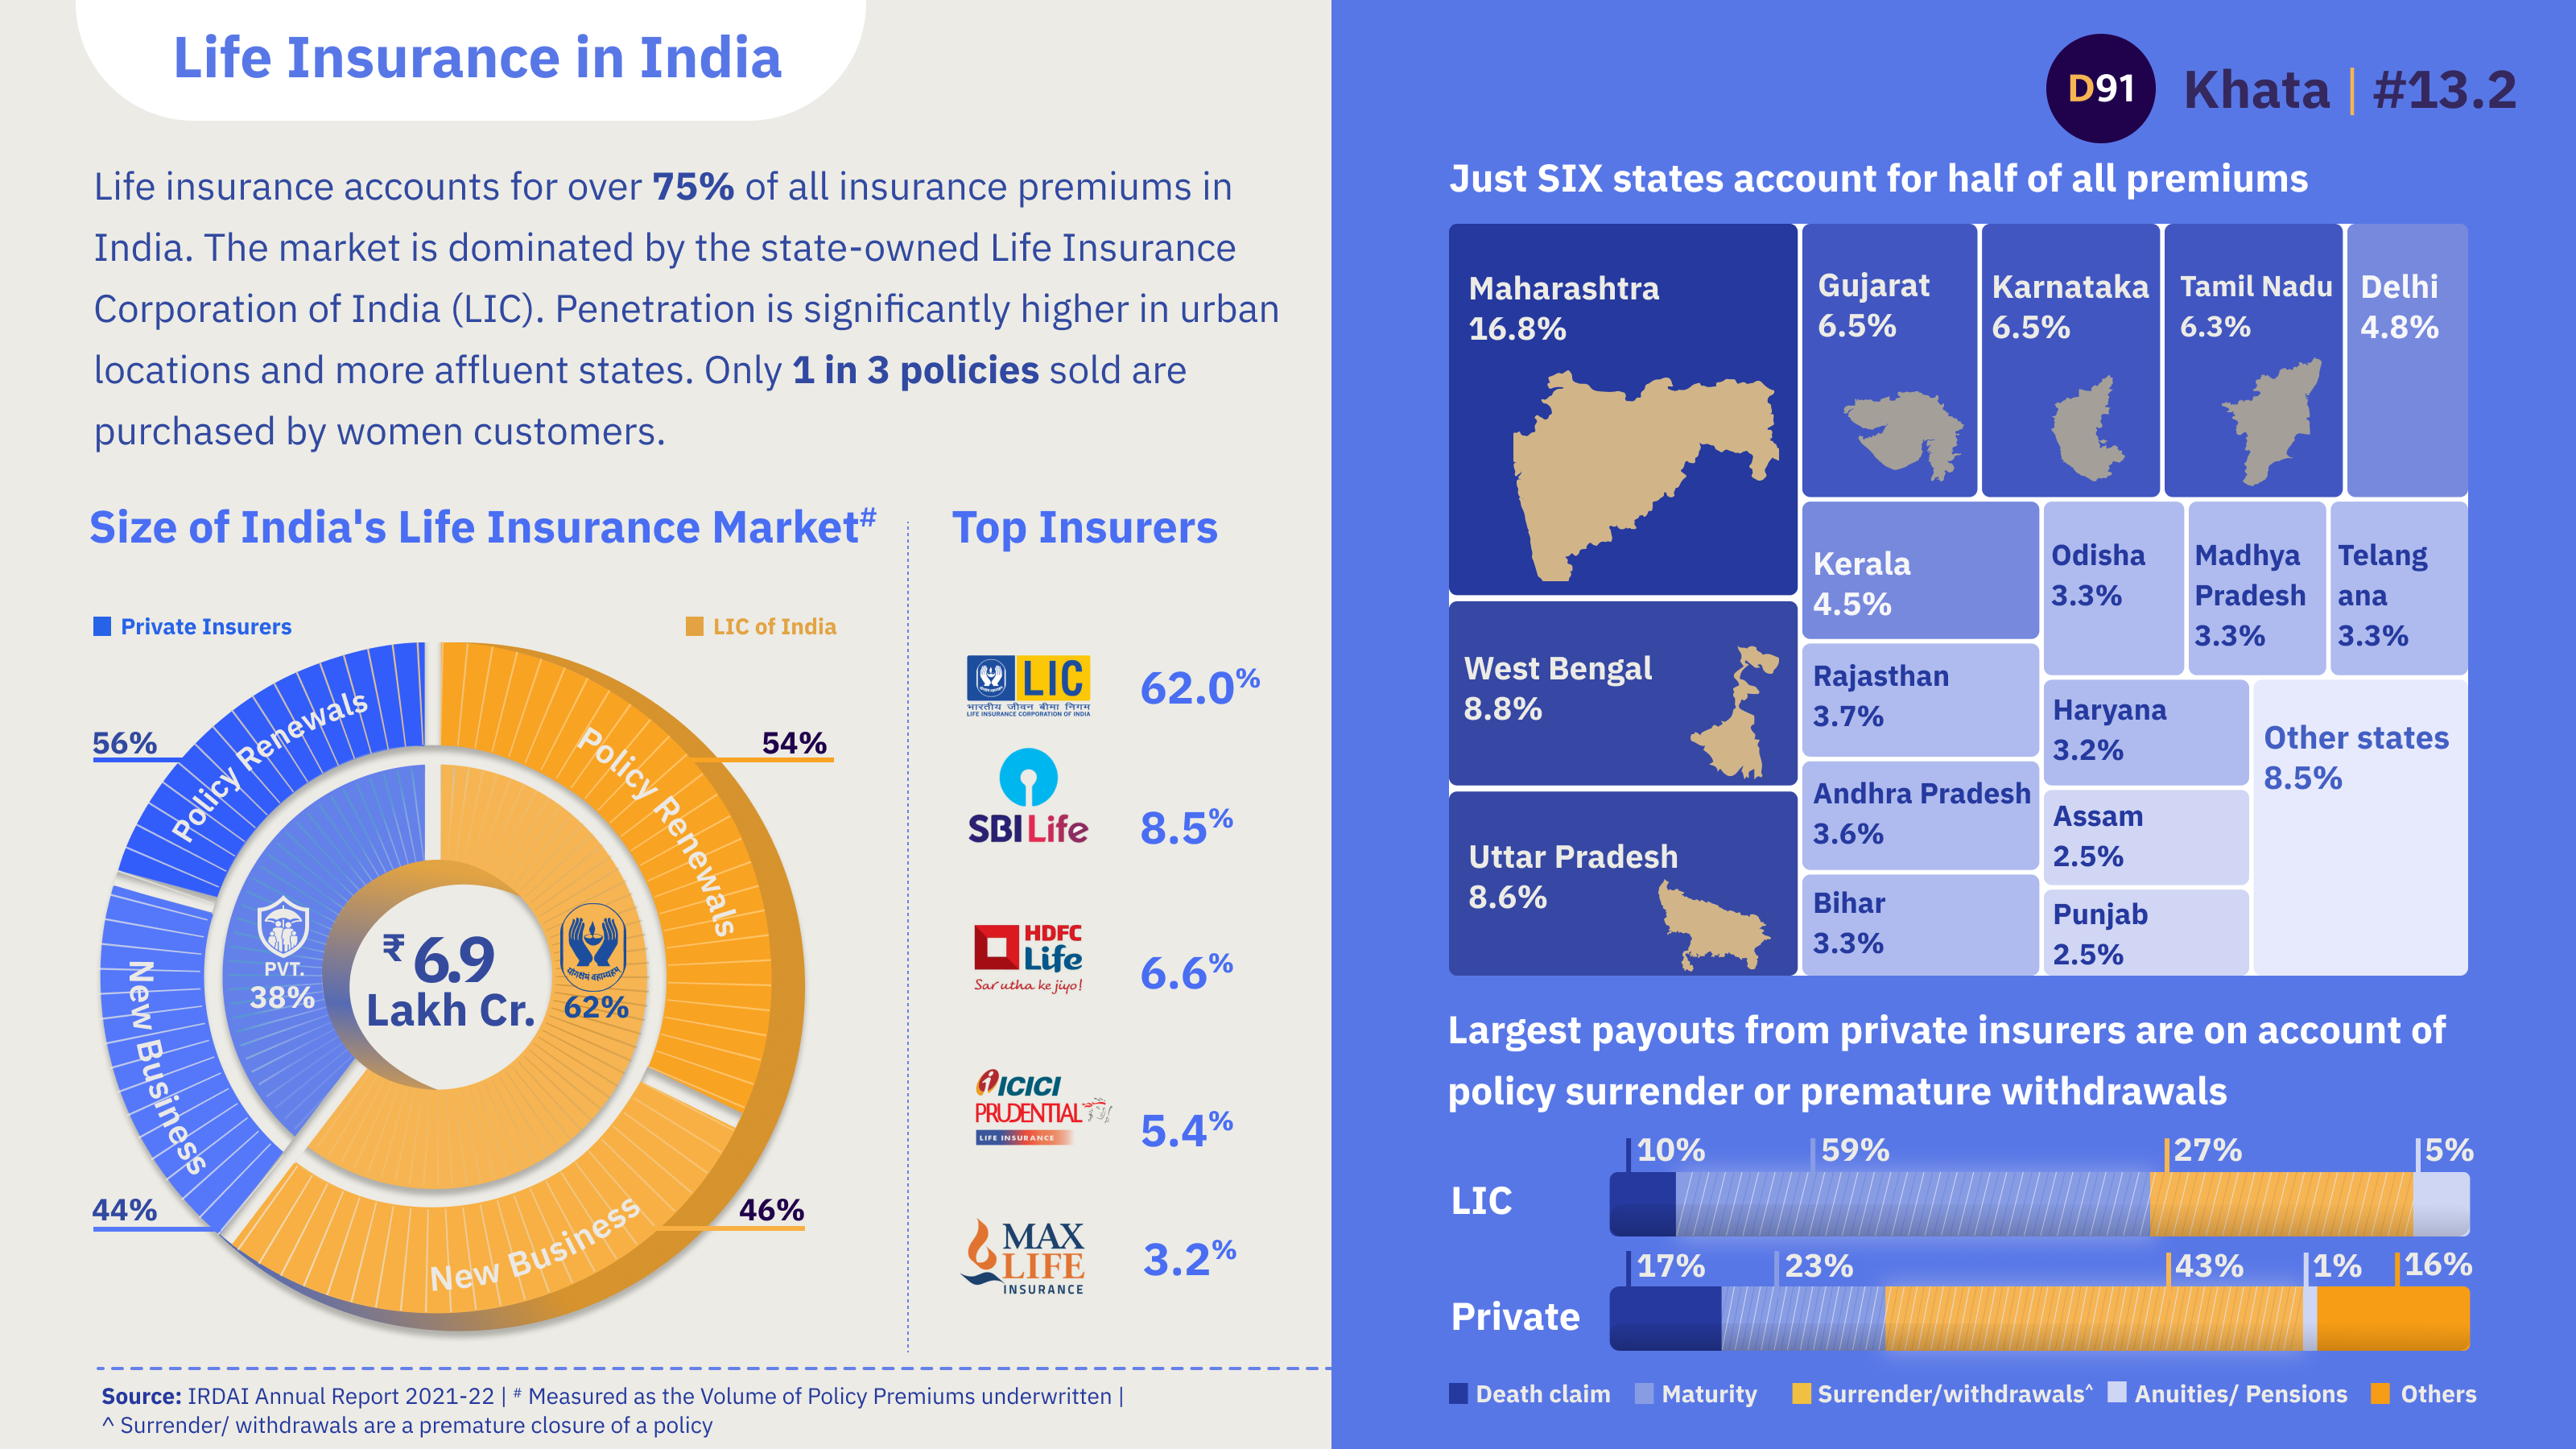
Life Insurance in India
Life insurance accounts for over 75% of all insurance premiums in India. The market is dominated by the state-owned Life Insurance Corporation of India (LIC). Penetration is significantly higher in urban locations and more affluent states. Only 1 in 3 policies sold are purchased by women customers.
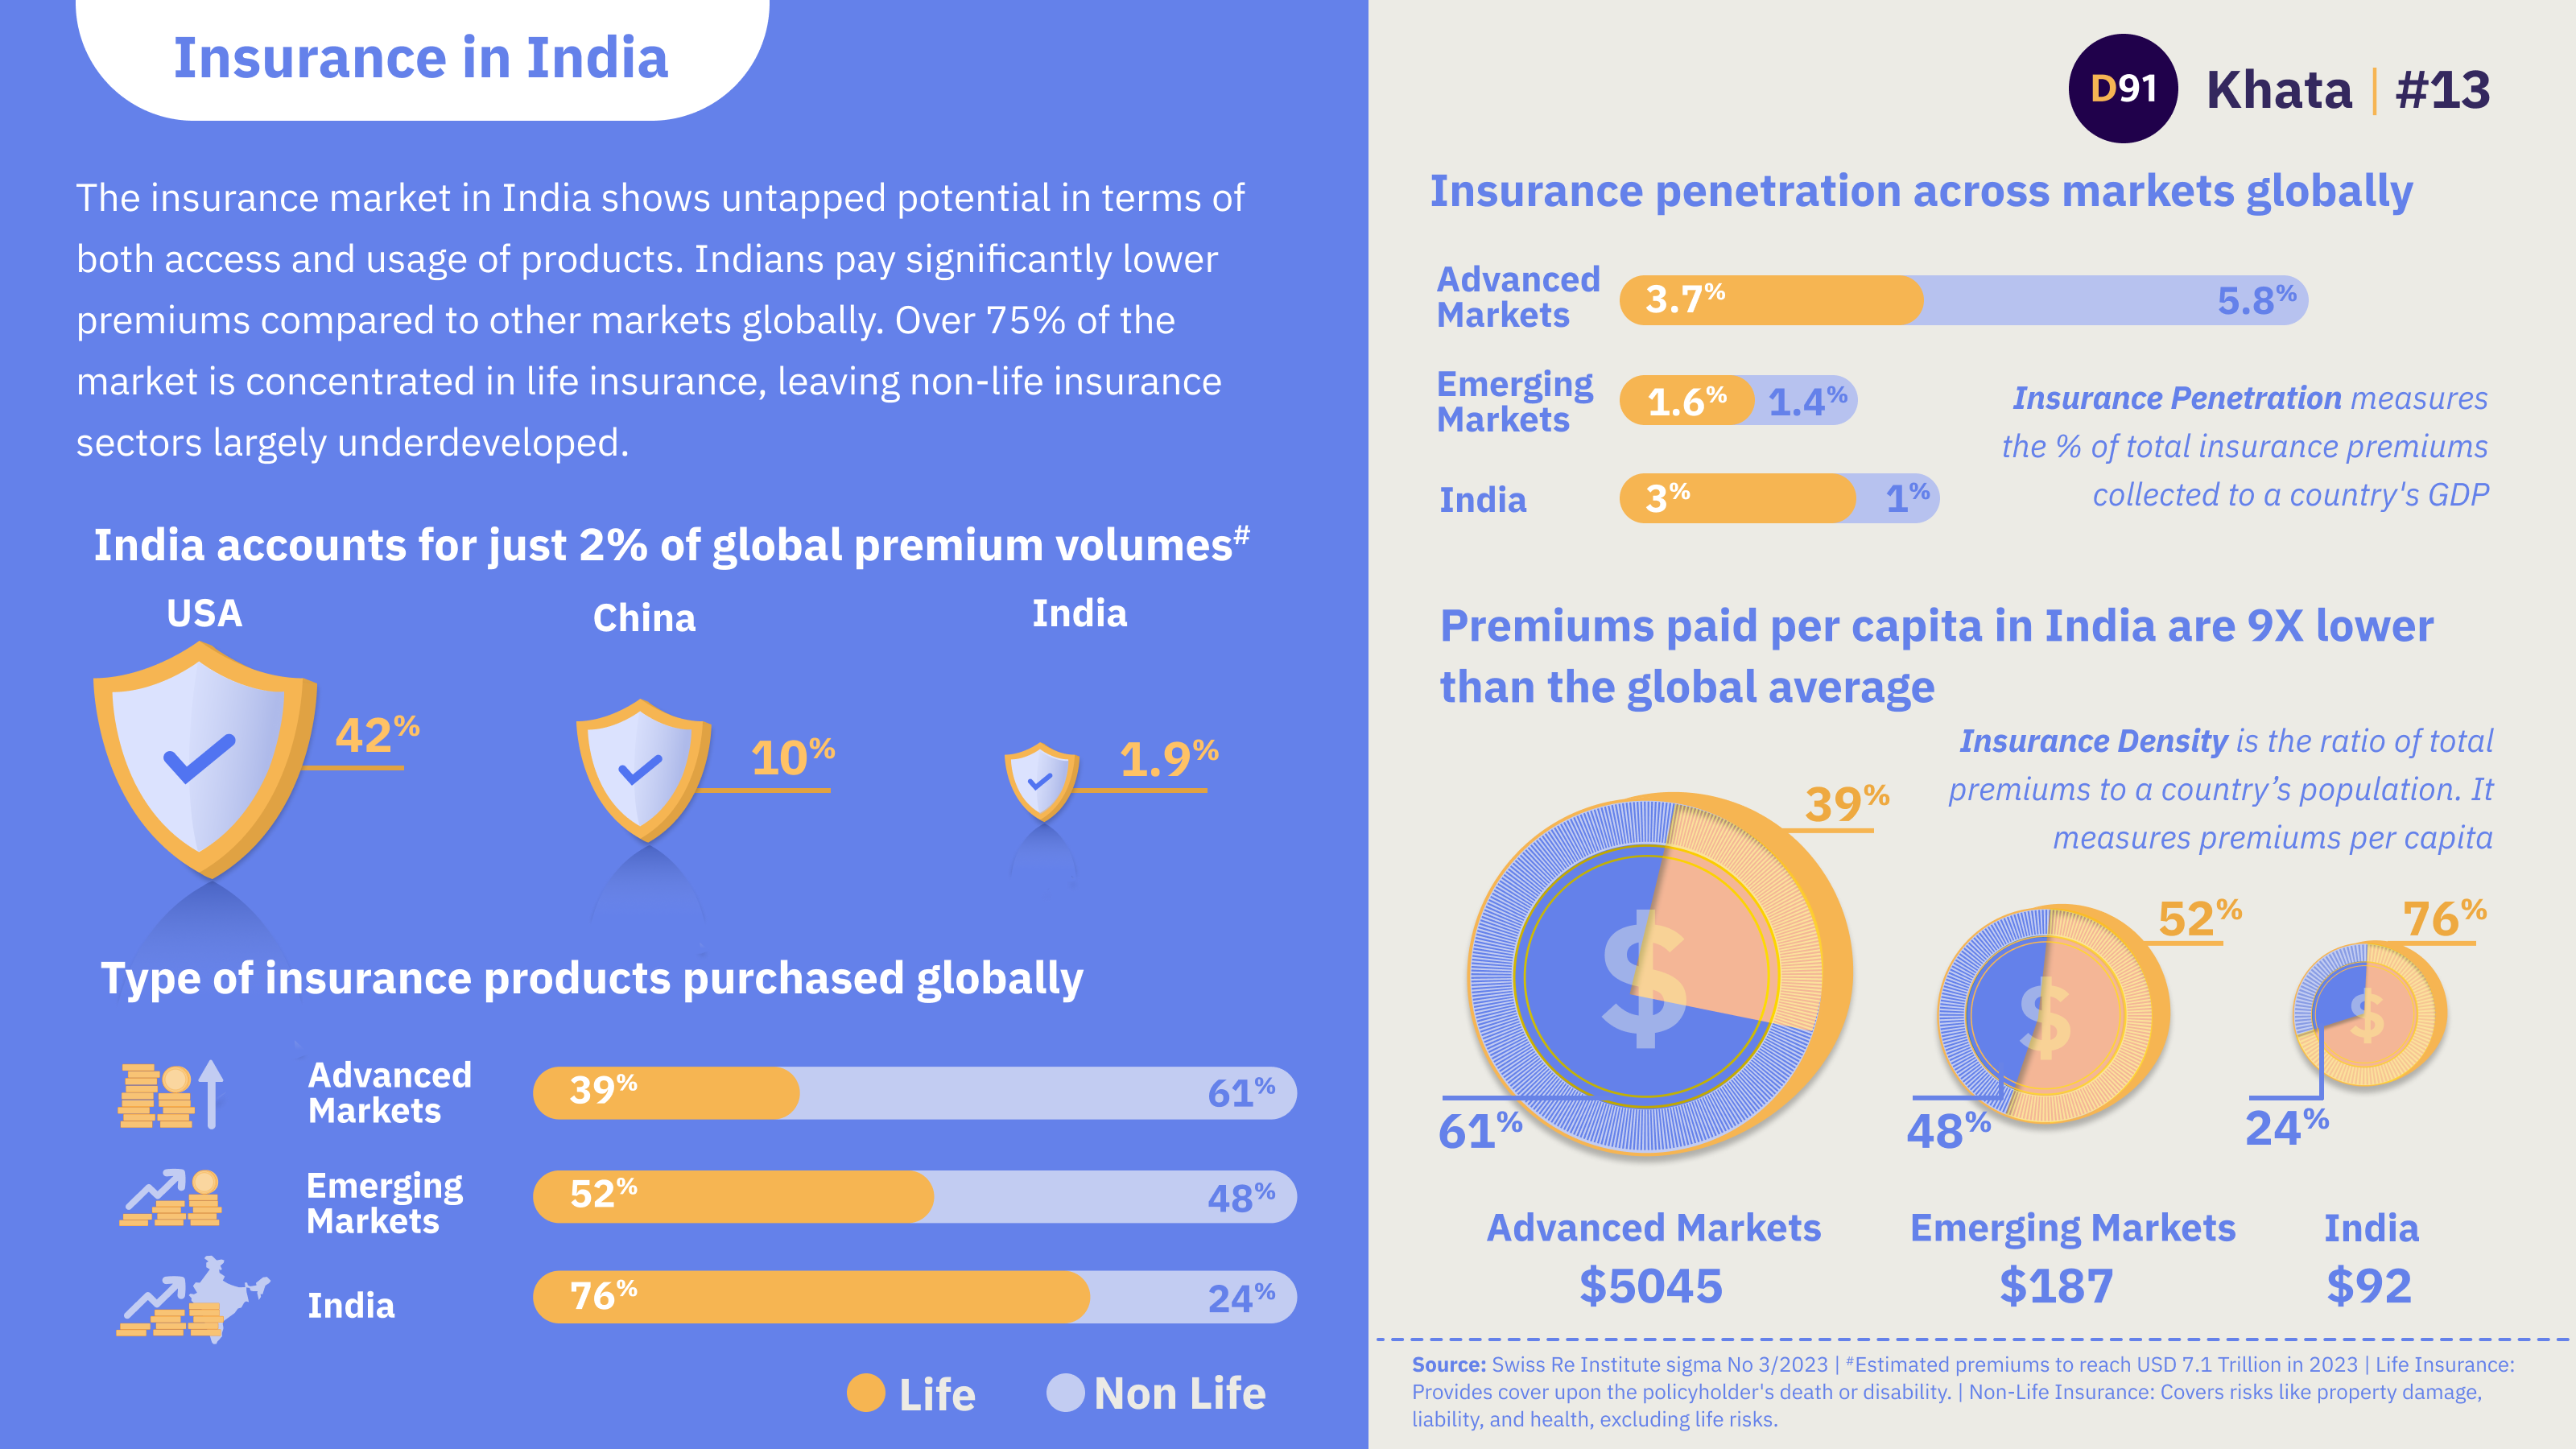
Insurance in India
The insurance market in India shows untapped potential in terms of both access and usage of products. Indians pay significantly lower premiums compared to other markets globally. Over 75% of the market is concentrated in life insurance, leaving non-life insurance sectors largely underdeveloped.
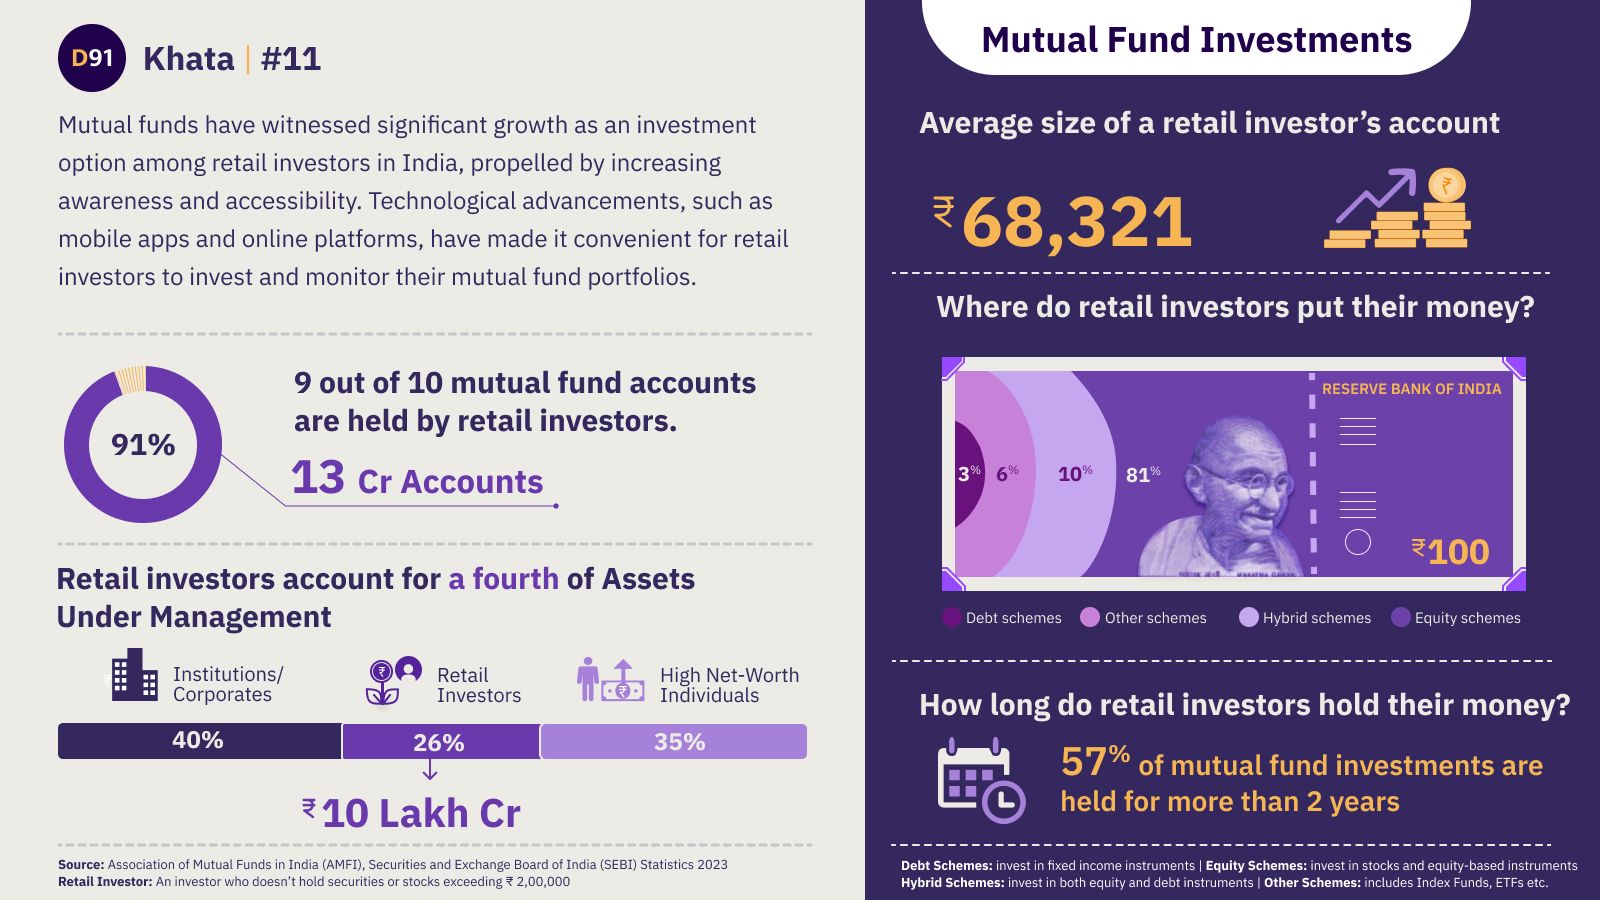
Mutual Fund Investments in India
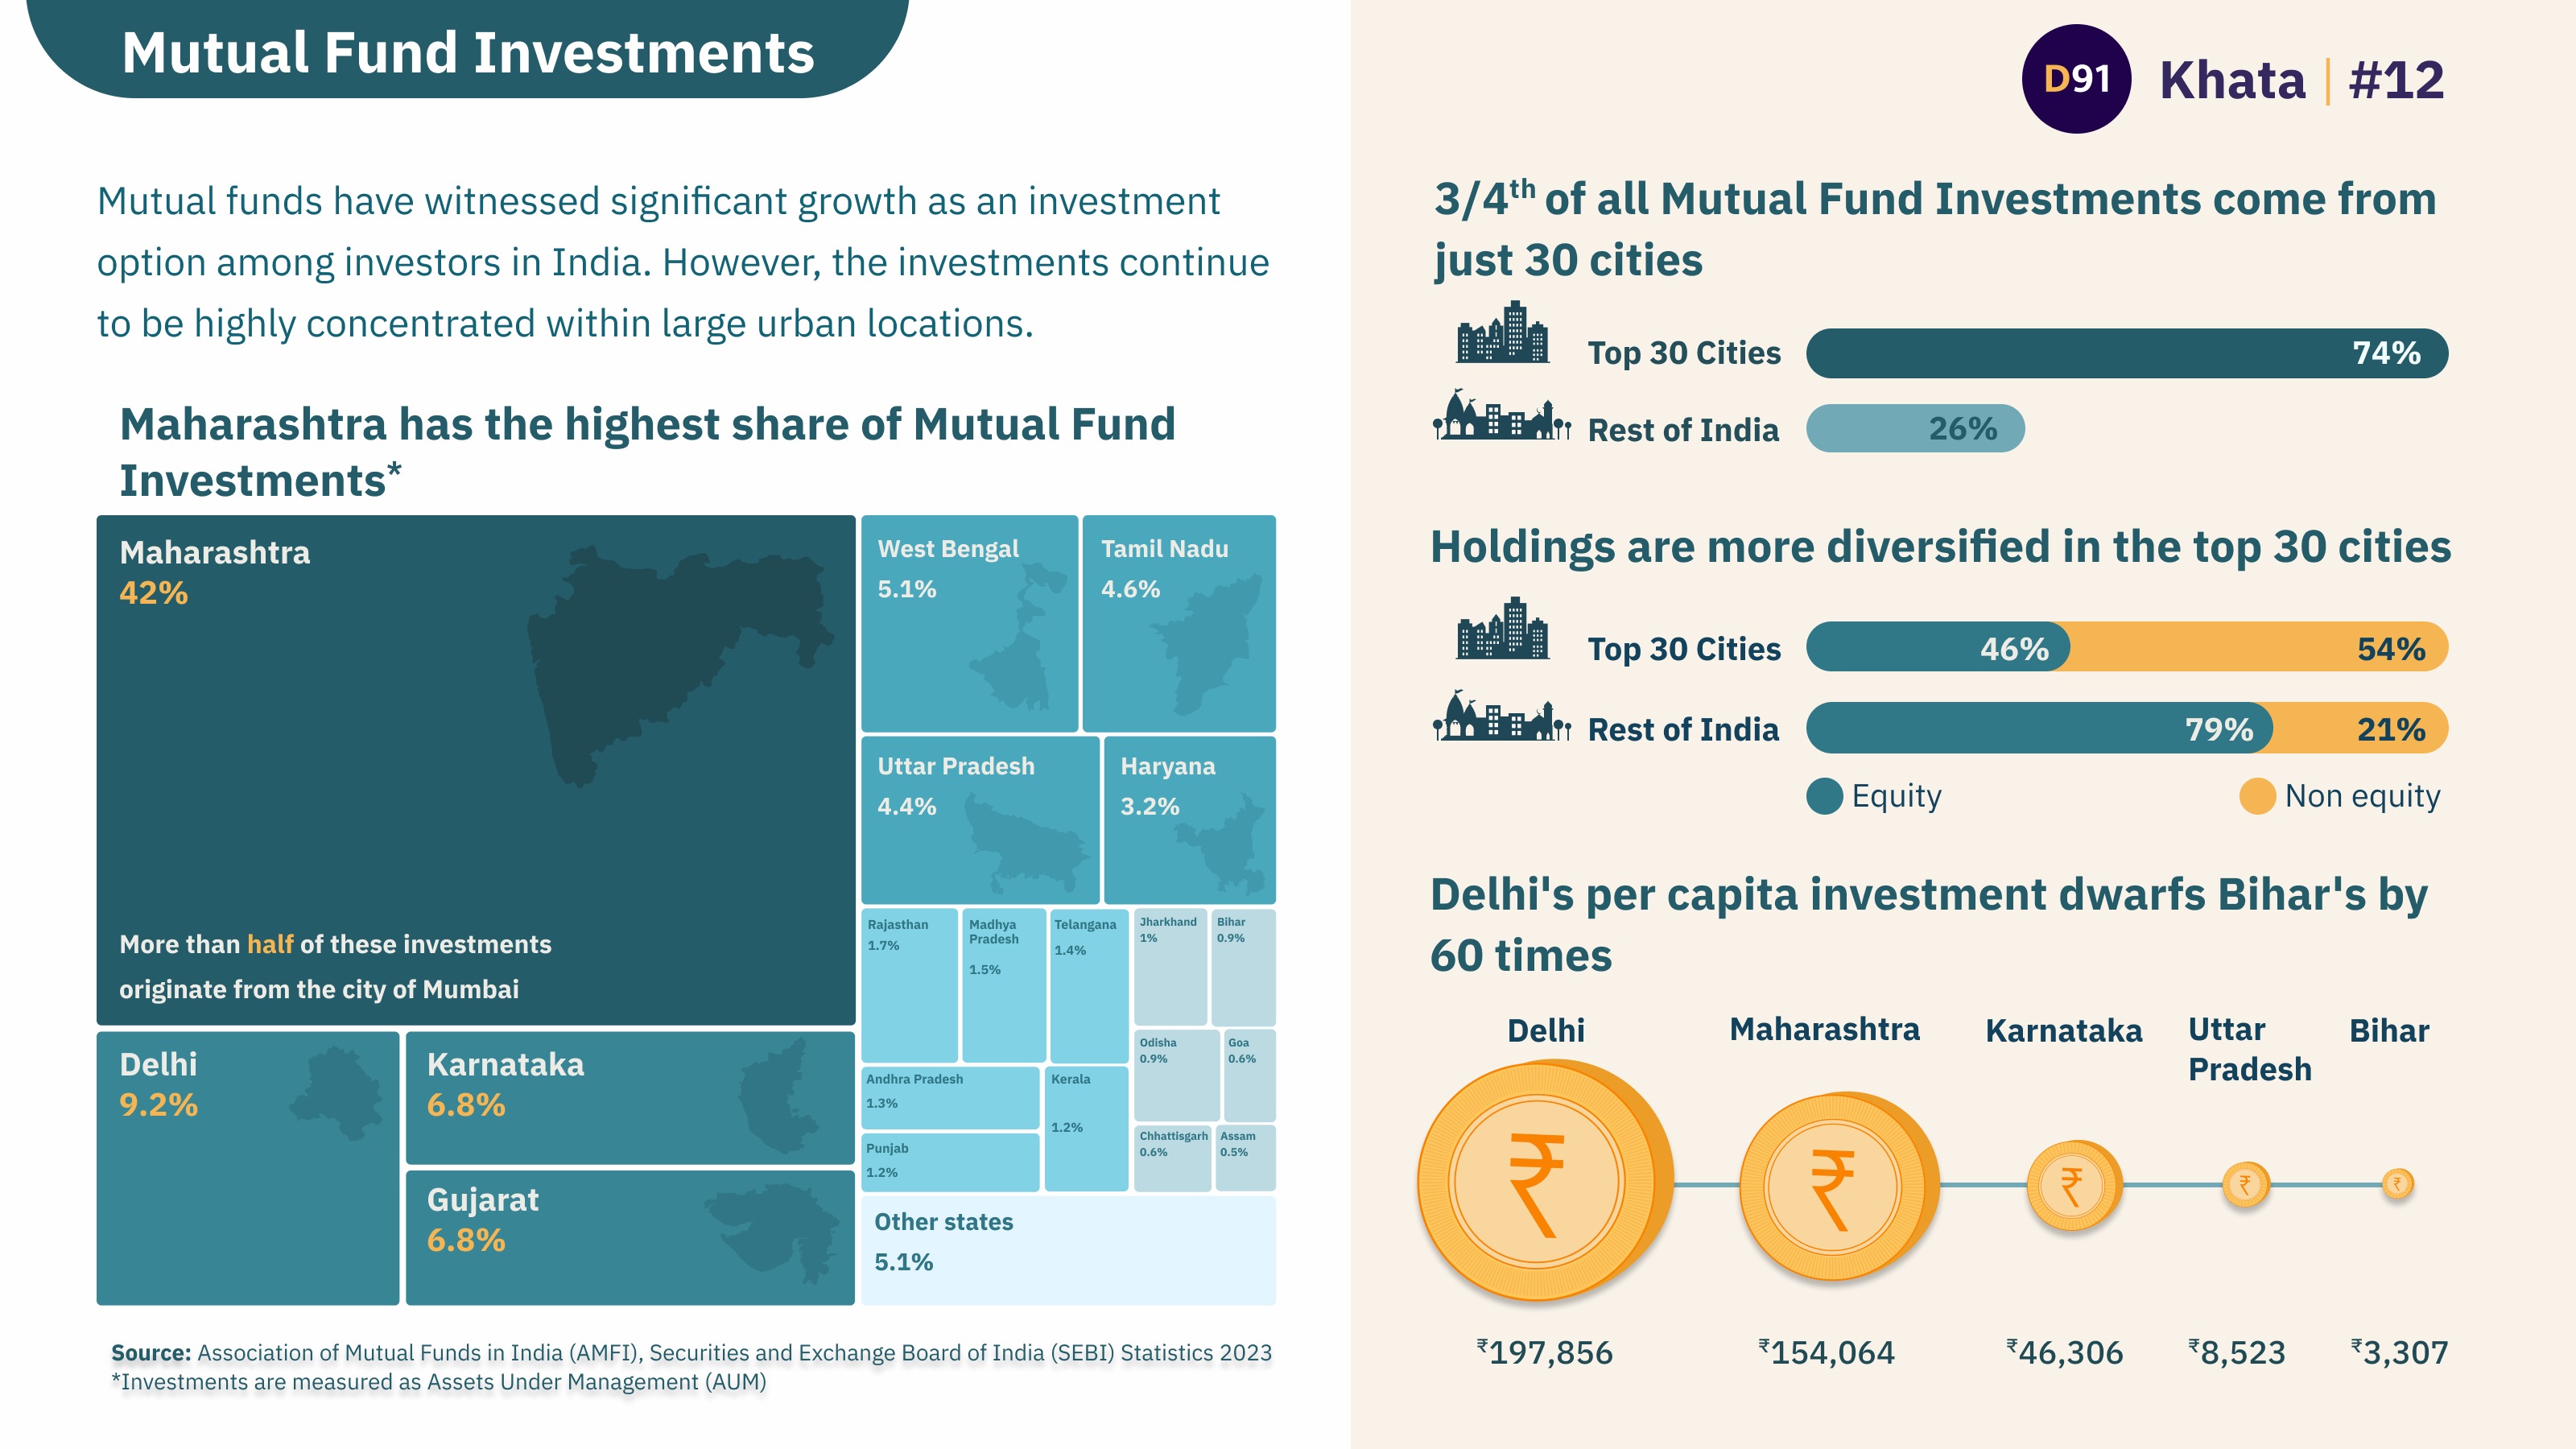
Mutual funds have witnessed significant growth as an investment option among investors in India. However, the investments continue to be highly concentrated within large urban locations.
Mutual Fund Investments in India
Technological advancements, such as mobile apps and online platforms, have made it convenient for retail investors to invest and monitor their mutual fund portfolios. Retail investors now account for over 26% of all Mutual Fund Assets Under Management.
How do international payments from India look like?
International (retail) payments from India have increased post the pandemic. International Payments by Indians have increased by 24% in value over the last six months. Credit Cards are the most prominent mode for making payments outside of India, accounting for half of all transactions by value.
Retail Digital Payment Systems in India
India's digital payment systems cater to diverse needs and use cases, from UPI for instant peer-to-peer transfers to Aadhaar-enabled payments for rural accessibility. They show the importance of innovation, ensuring convenience and financial inclusion.
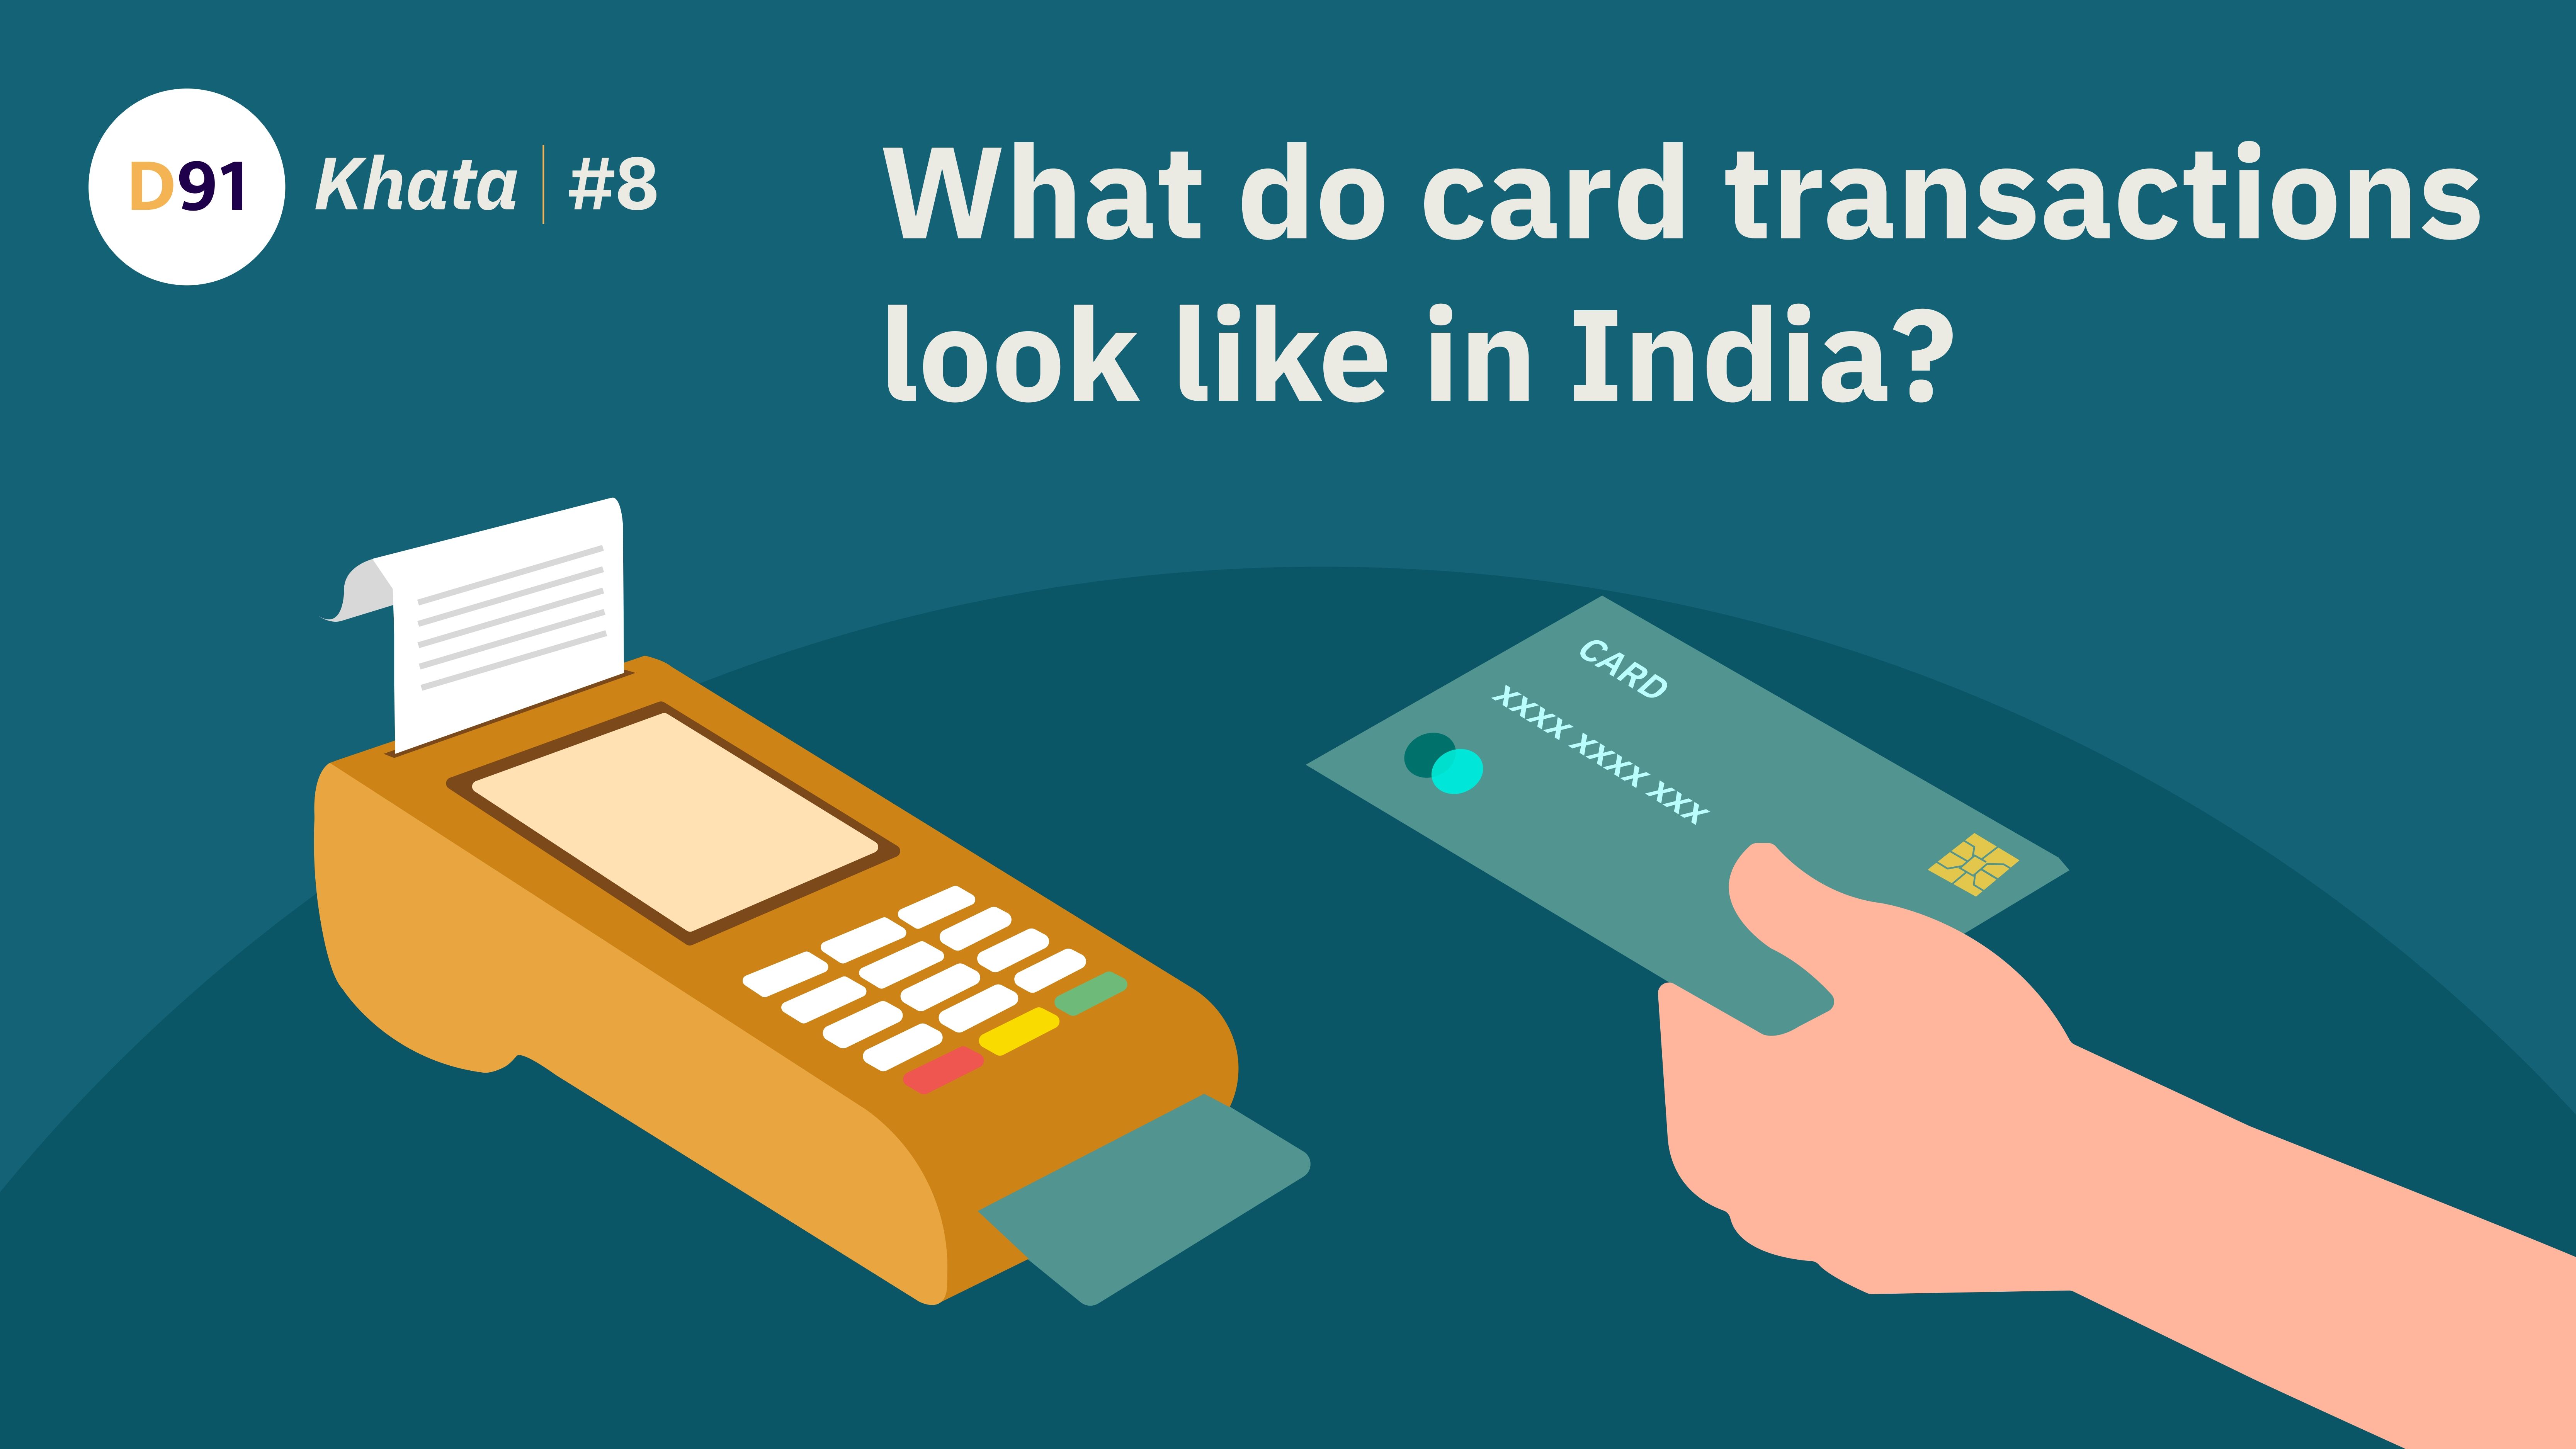
What do Card Transactions look like in India?
Credit card spending in India has surged over 10% in the past year, driven by aspirational marketing, attractive offers, and the emergence of e-commerce. In contrast, debit card transactions have declined significantly as the widespread adoption of UPI provides a more convenient payment alternative.
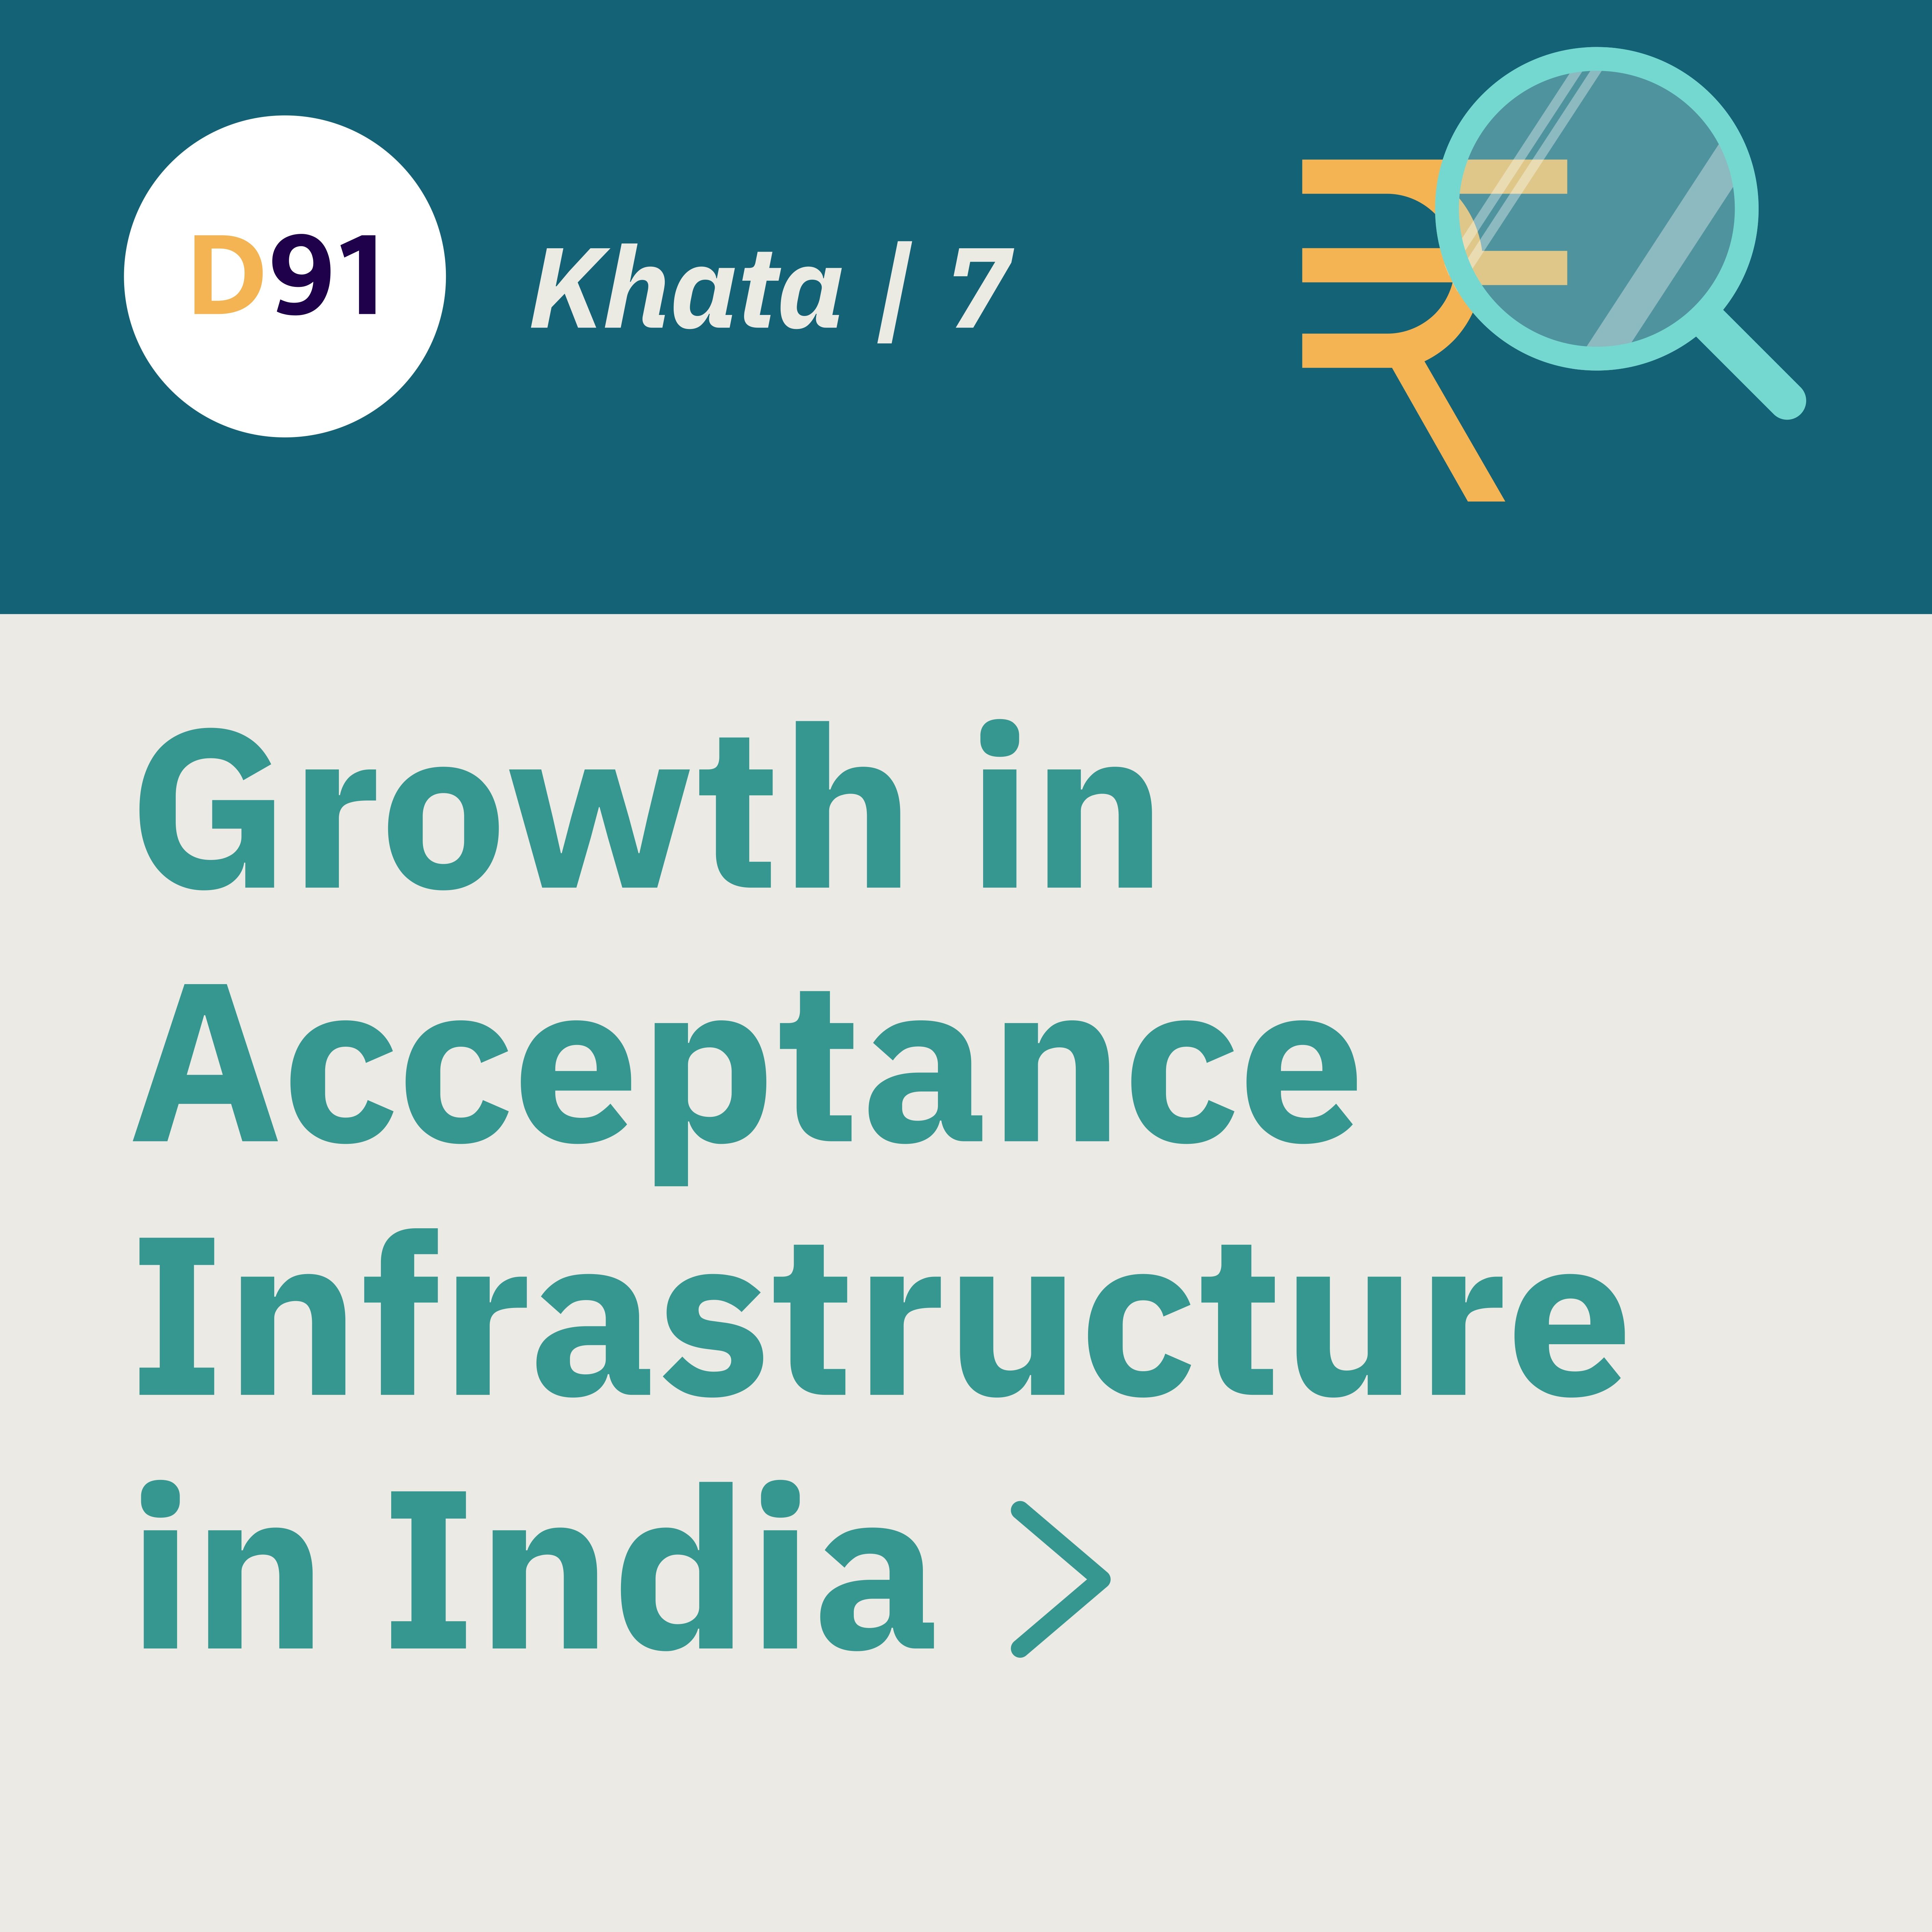
Growth in Acceptance Infrastructure in India
The government's push towards a digital economy and financial inclusion, coupled with a growing middle class, has played a crucial role in expanding payment acceptance infrastructure in India.
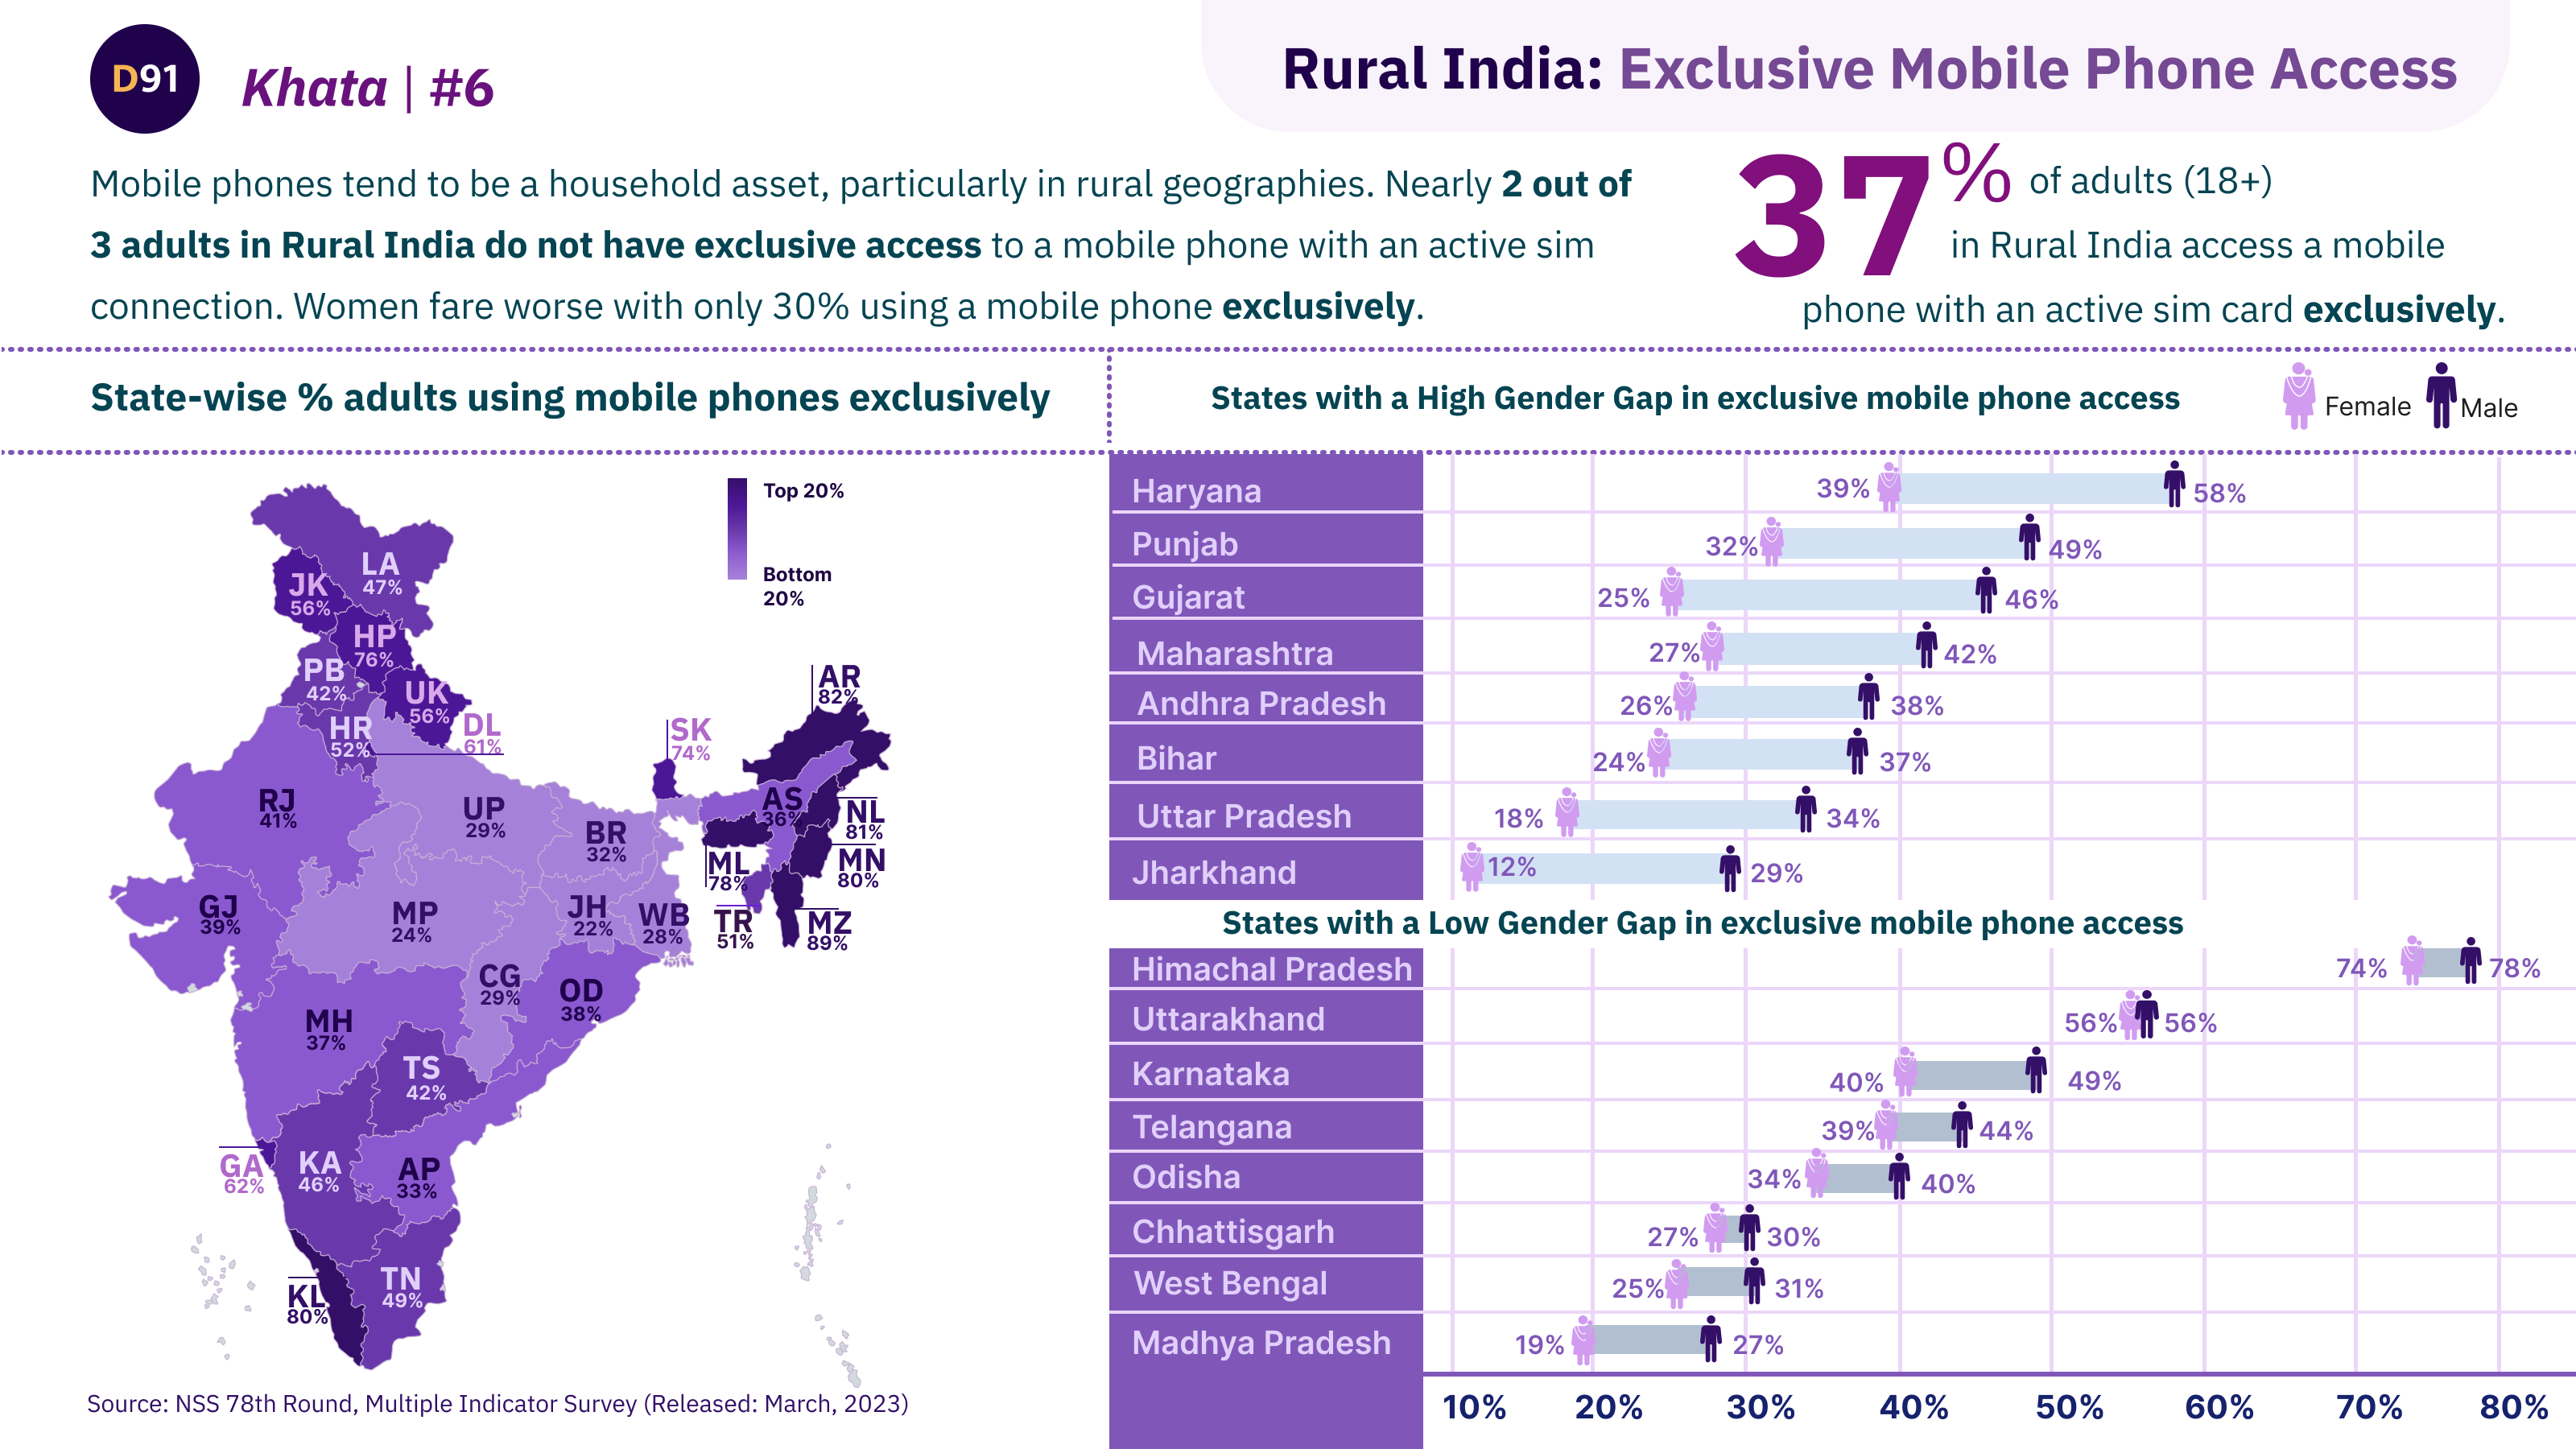
Exclusive Access to Mobile Phones: Rural India
2 out of 3 adults in Rural India do not have exclusive access to a mobile phone with an active sim connection. Women fare significantly worse with more than 70% not having exclusive access to a mobile phone in Rural areas.
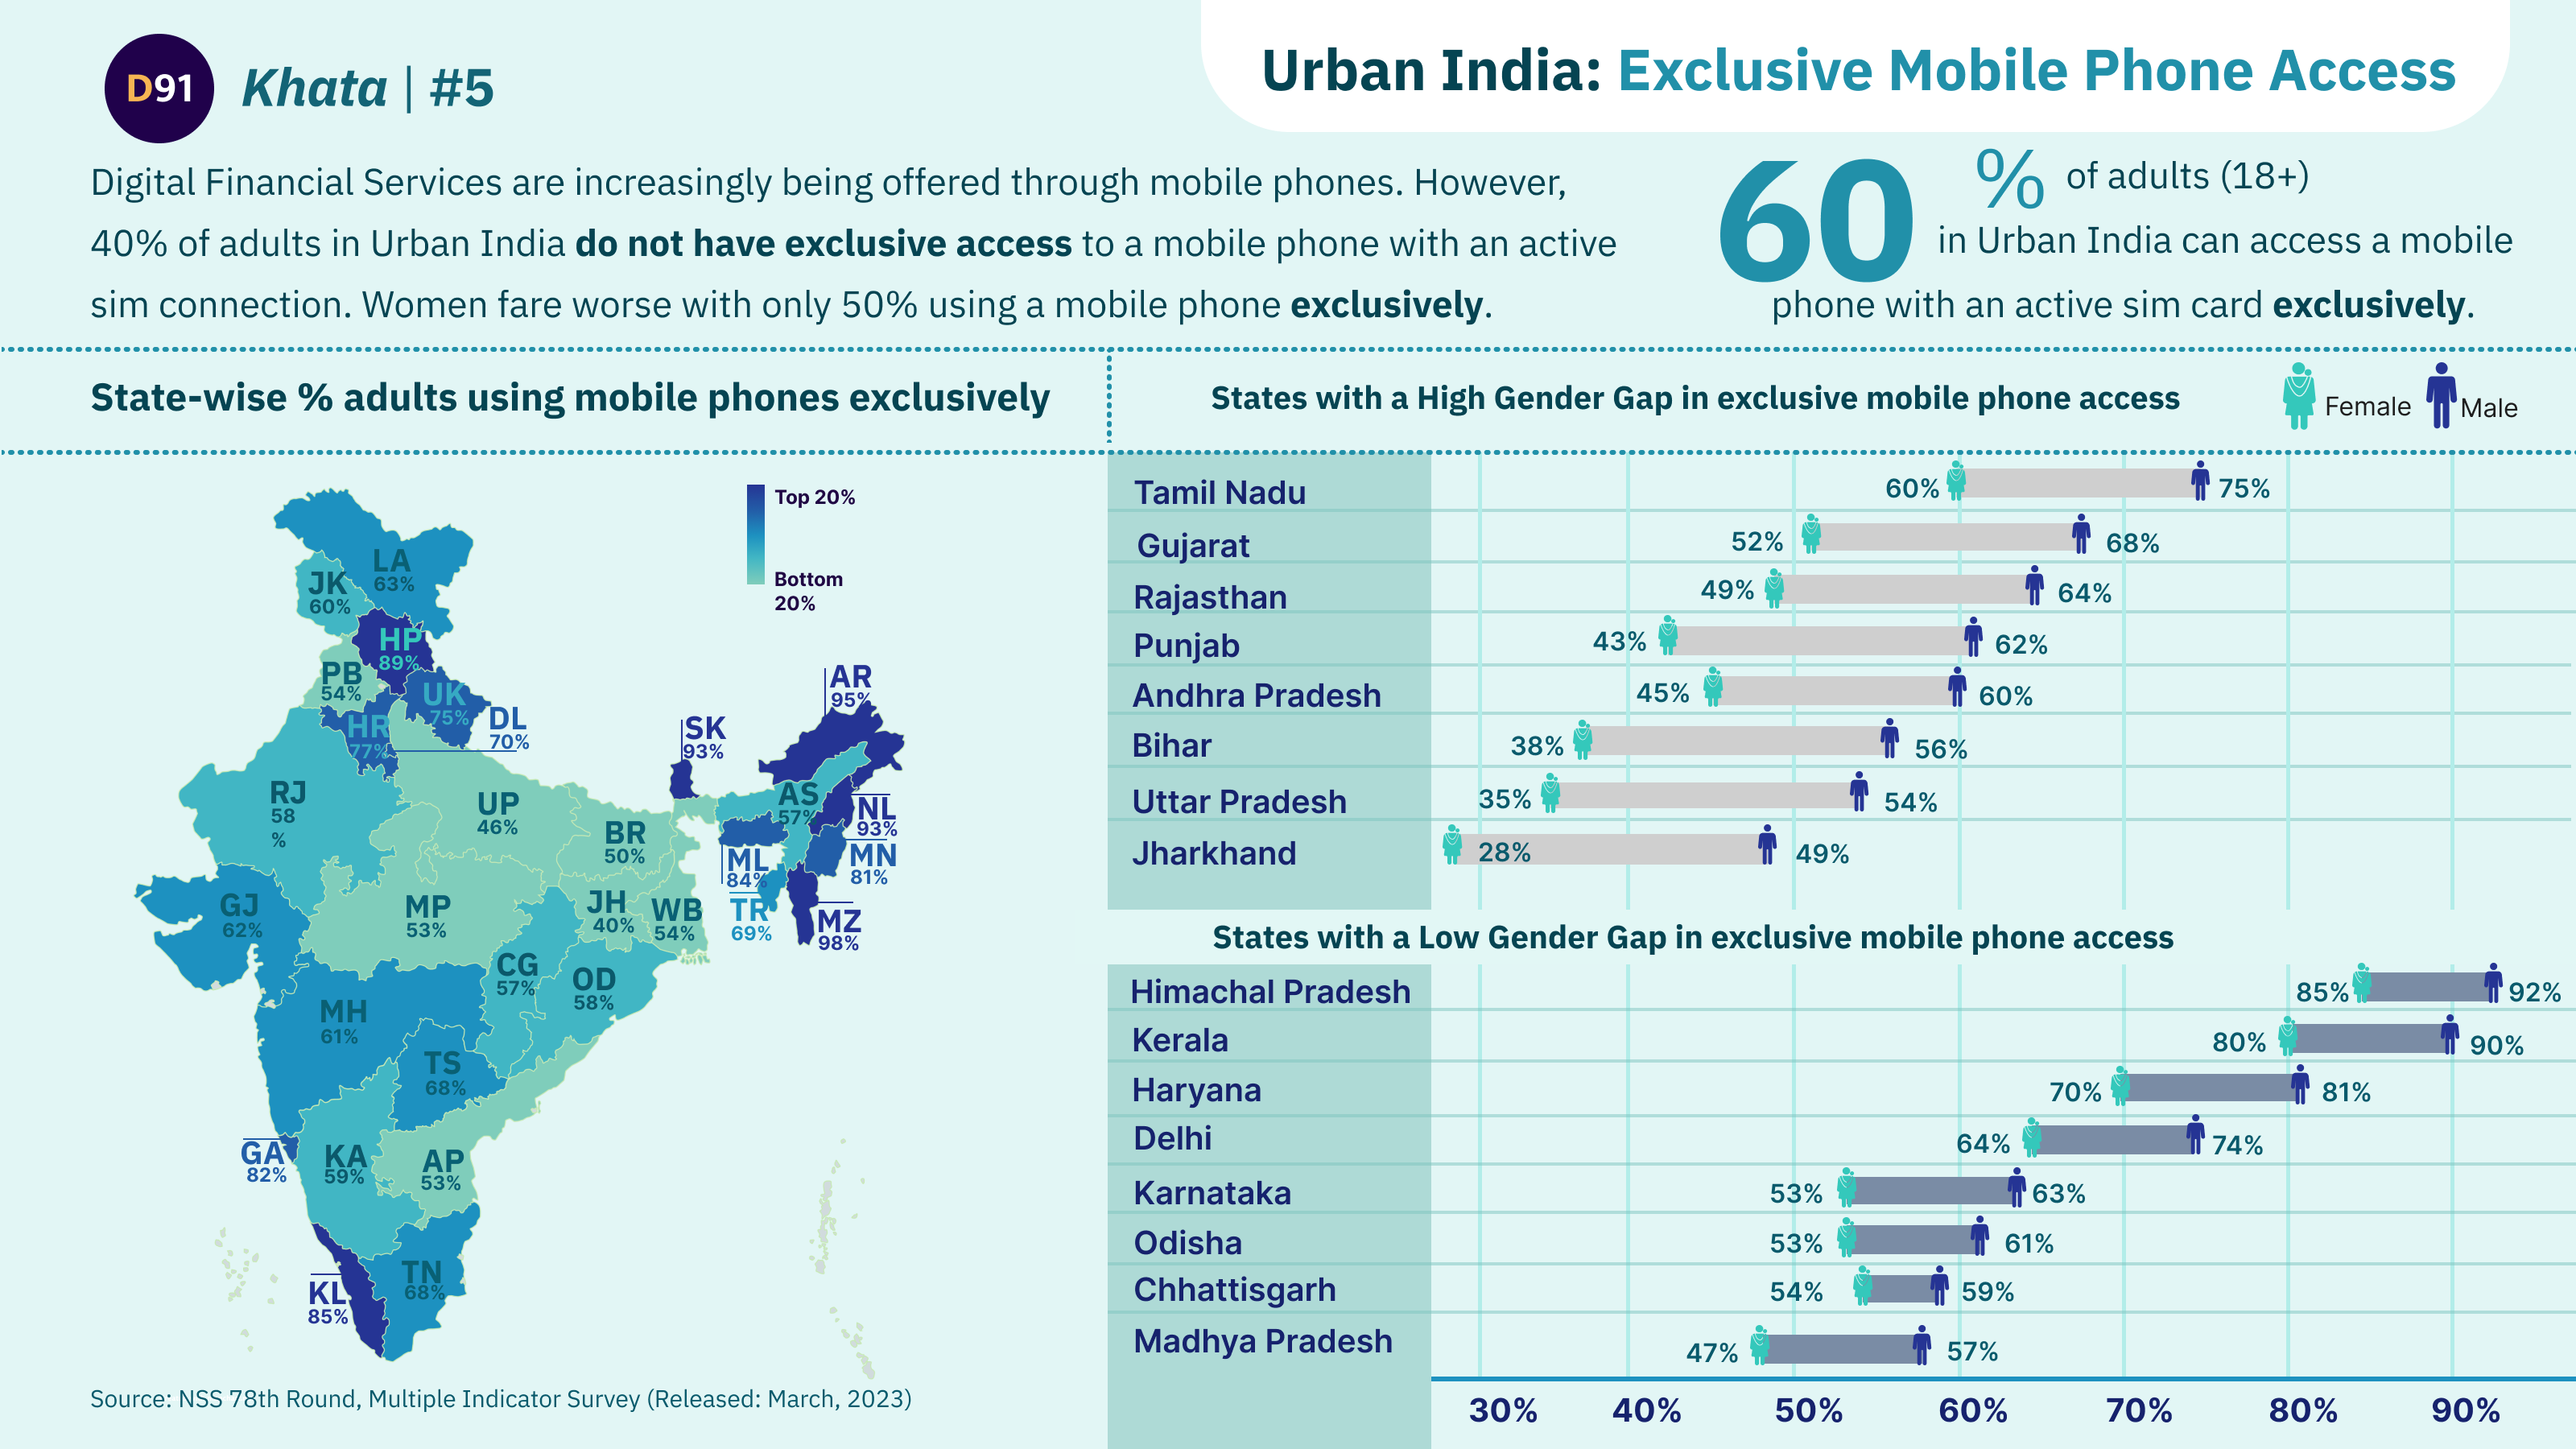
Exclusive Access to Mobile Phones: Urban India
40% of adults in Urban India do not have exclusive access to a mobile phone with an active sim connection. Women fare worse with nearly 50% not having exclusive access. Regional disparities persist.
Indian Household: Income Classification
India’s favourable demographic trends, which have raised the proportion of the workforce in the total population, have set the stage for a massive expansion of the middle class.
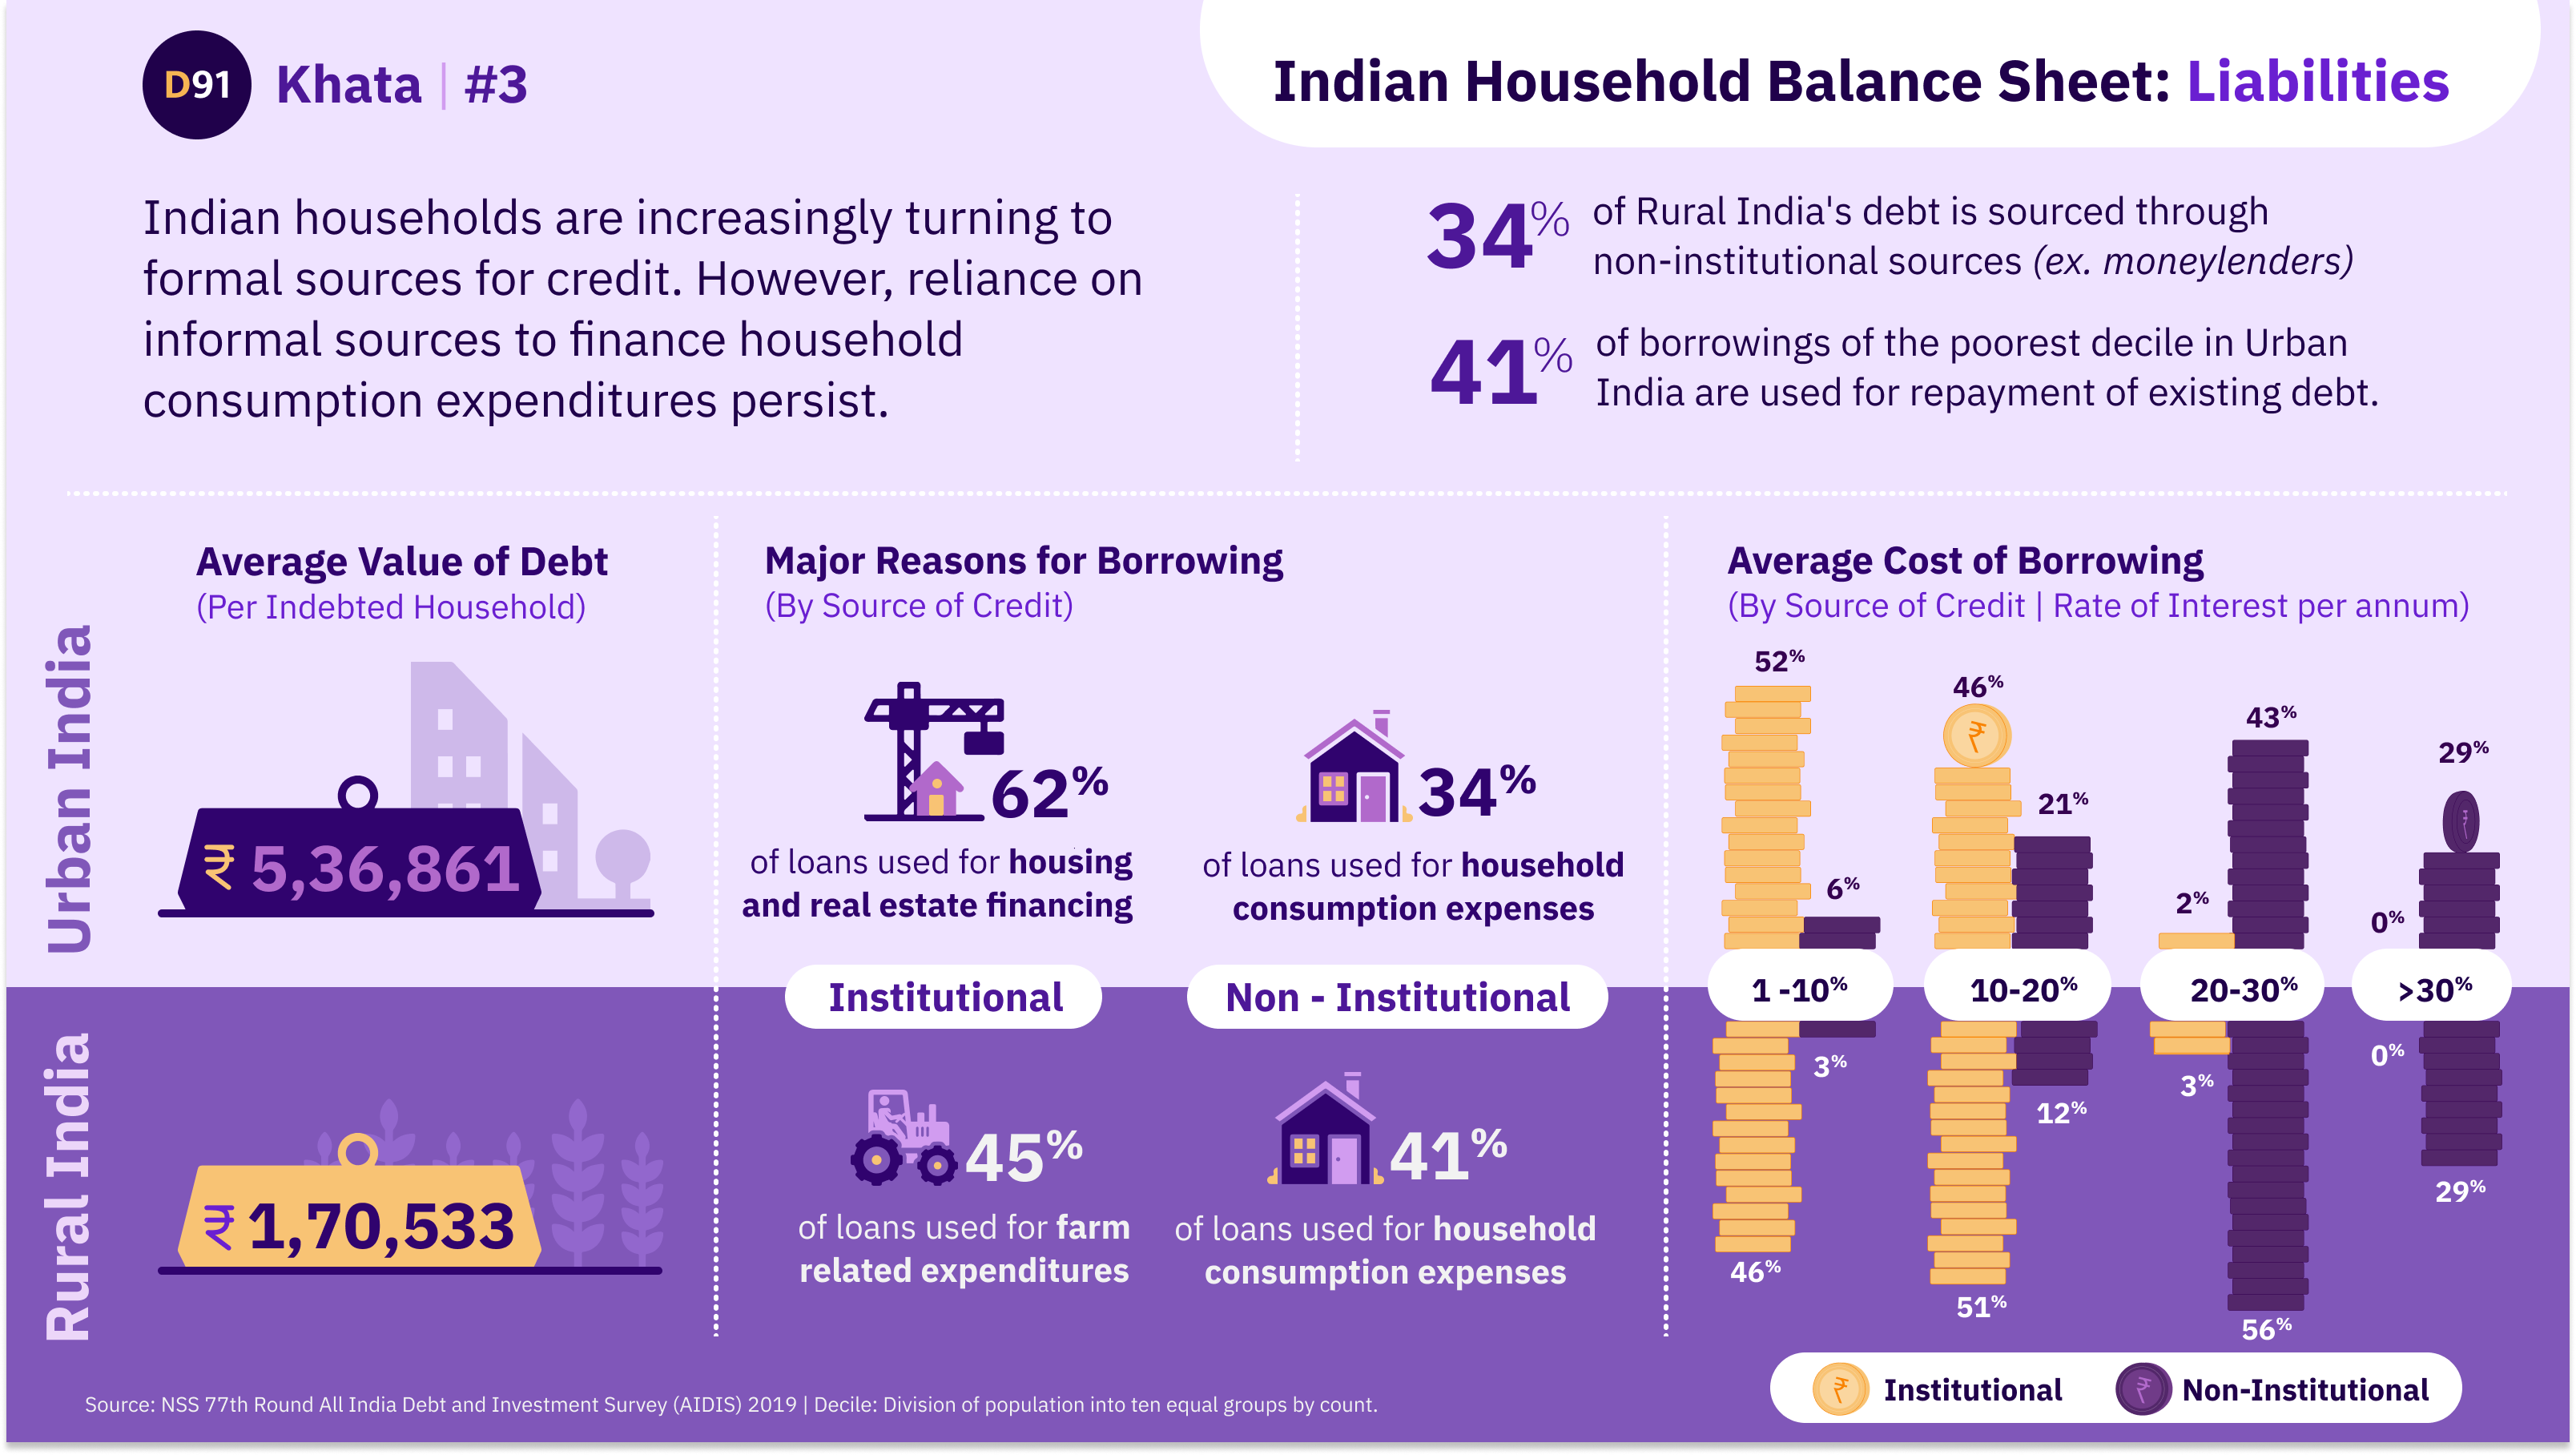
Indian Household Balance Sheet: Liabilities
Indian households are increasingly turning to formal sources for credit. However, informal sources remain an important channel for financing everyday household consumption expenses.
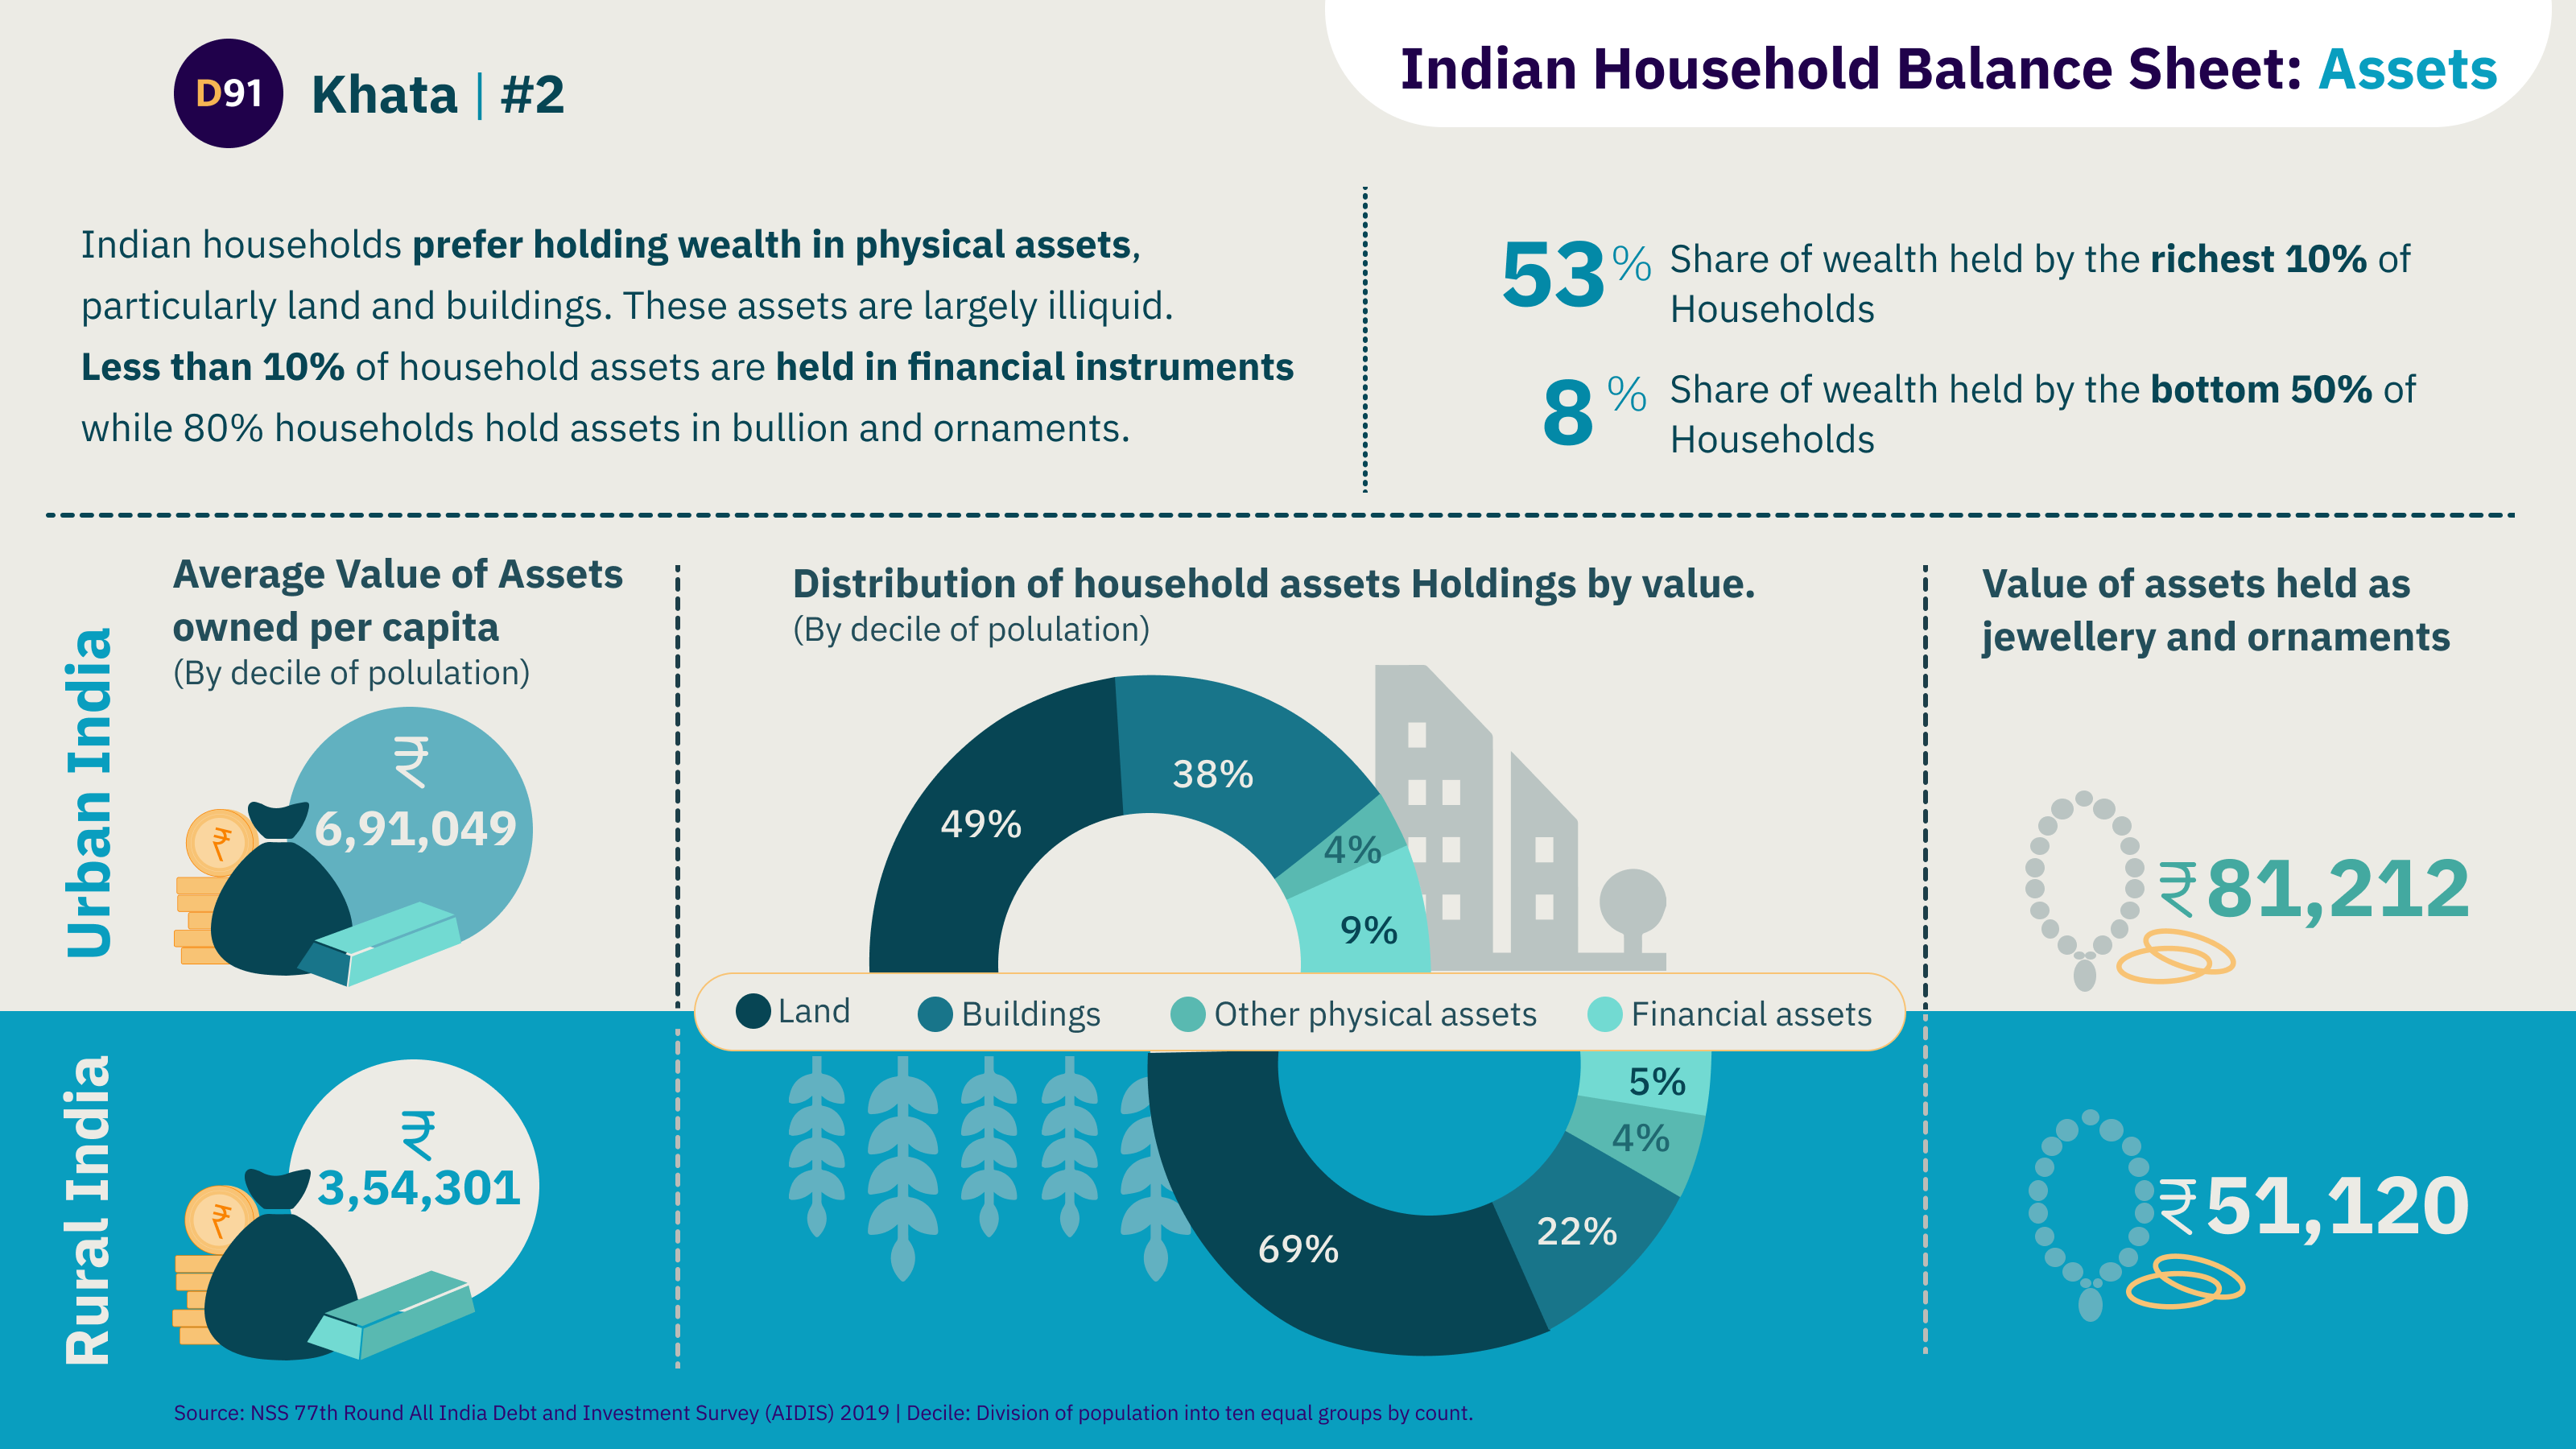
Indian Household Balance Sheet: Assets
Indian households store most of their wealth in physical assets. But there's a stark difference in value of assets owned by the lowest and highest decile of Bharat.
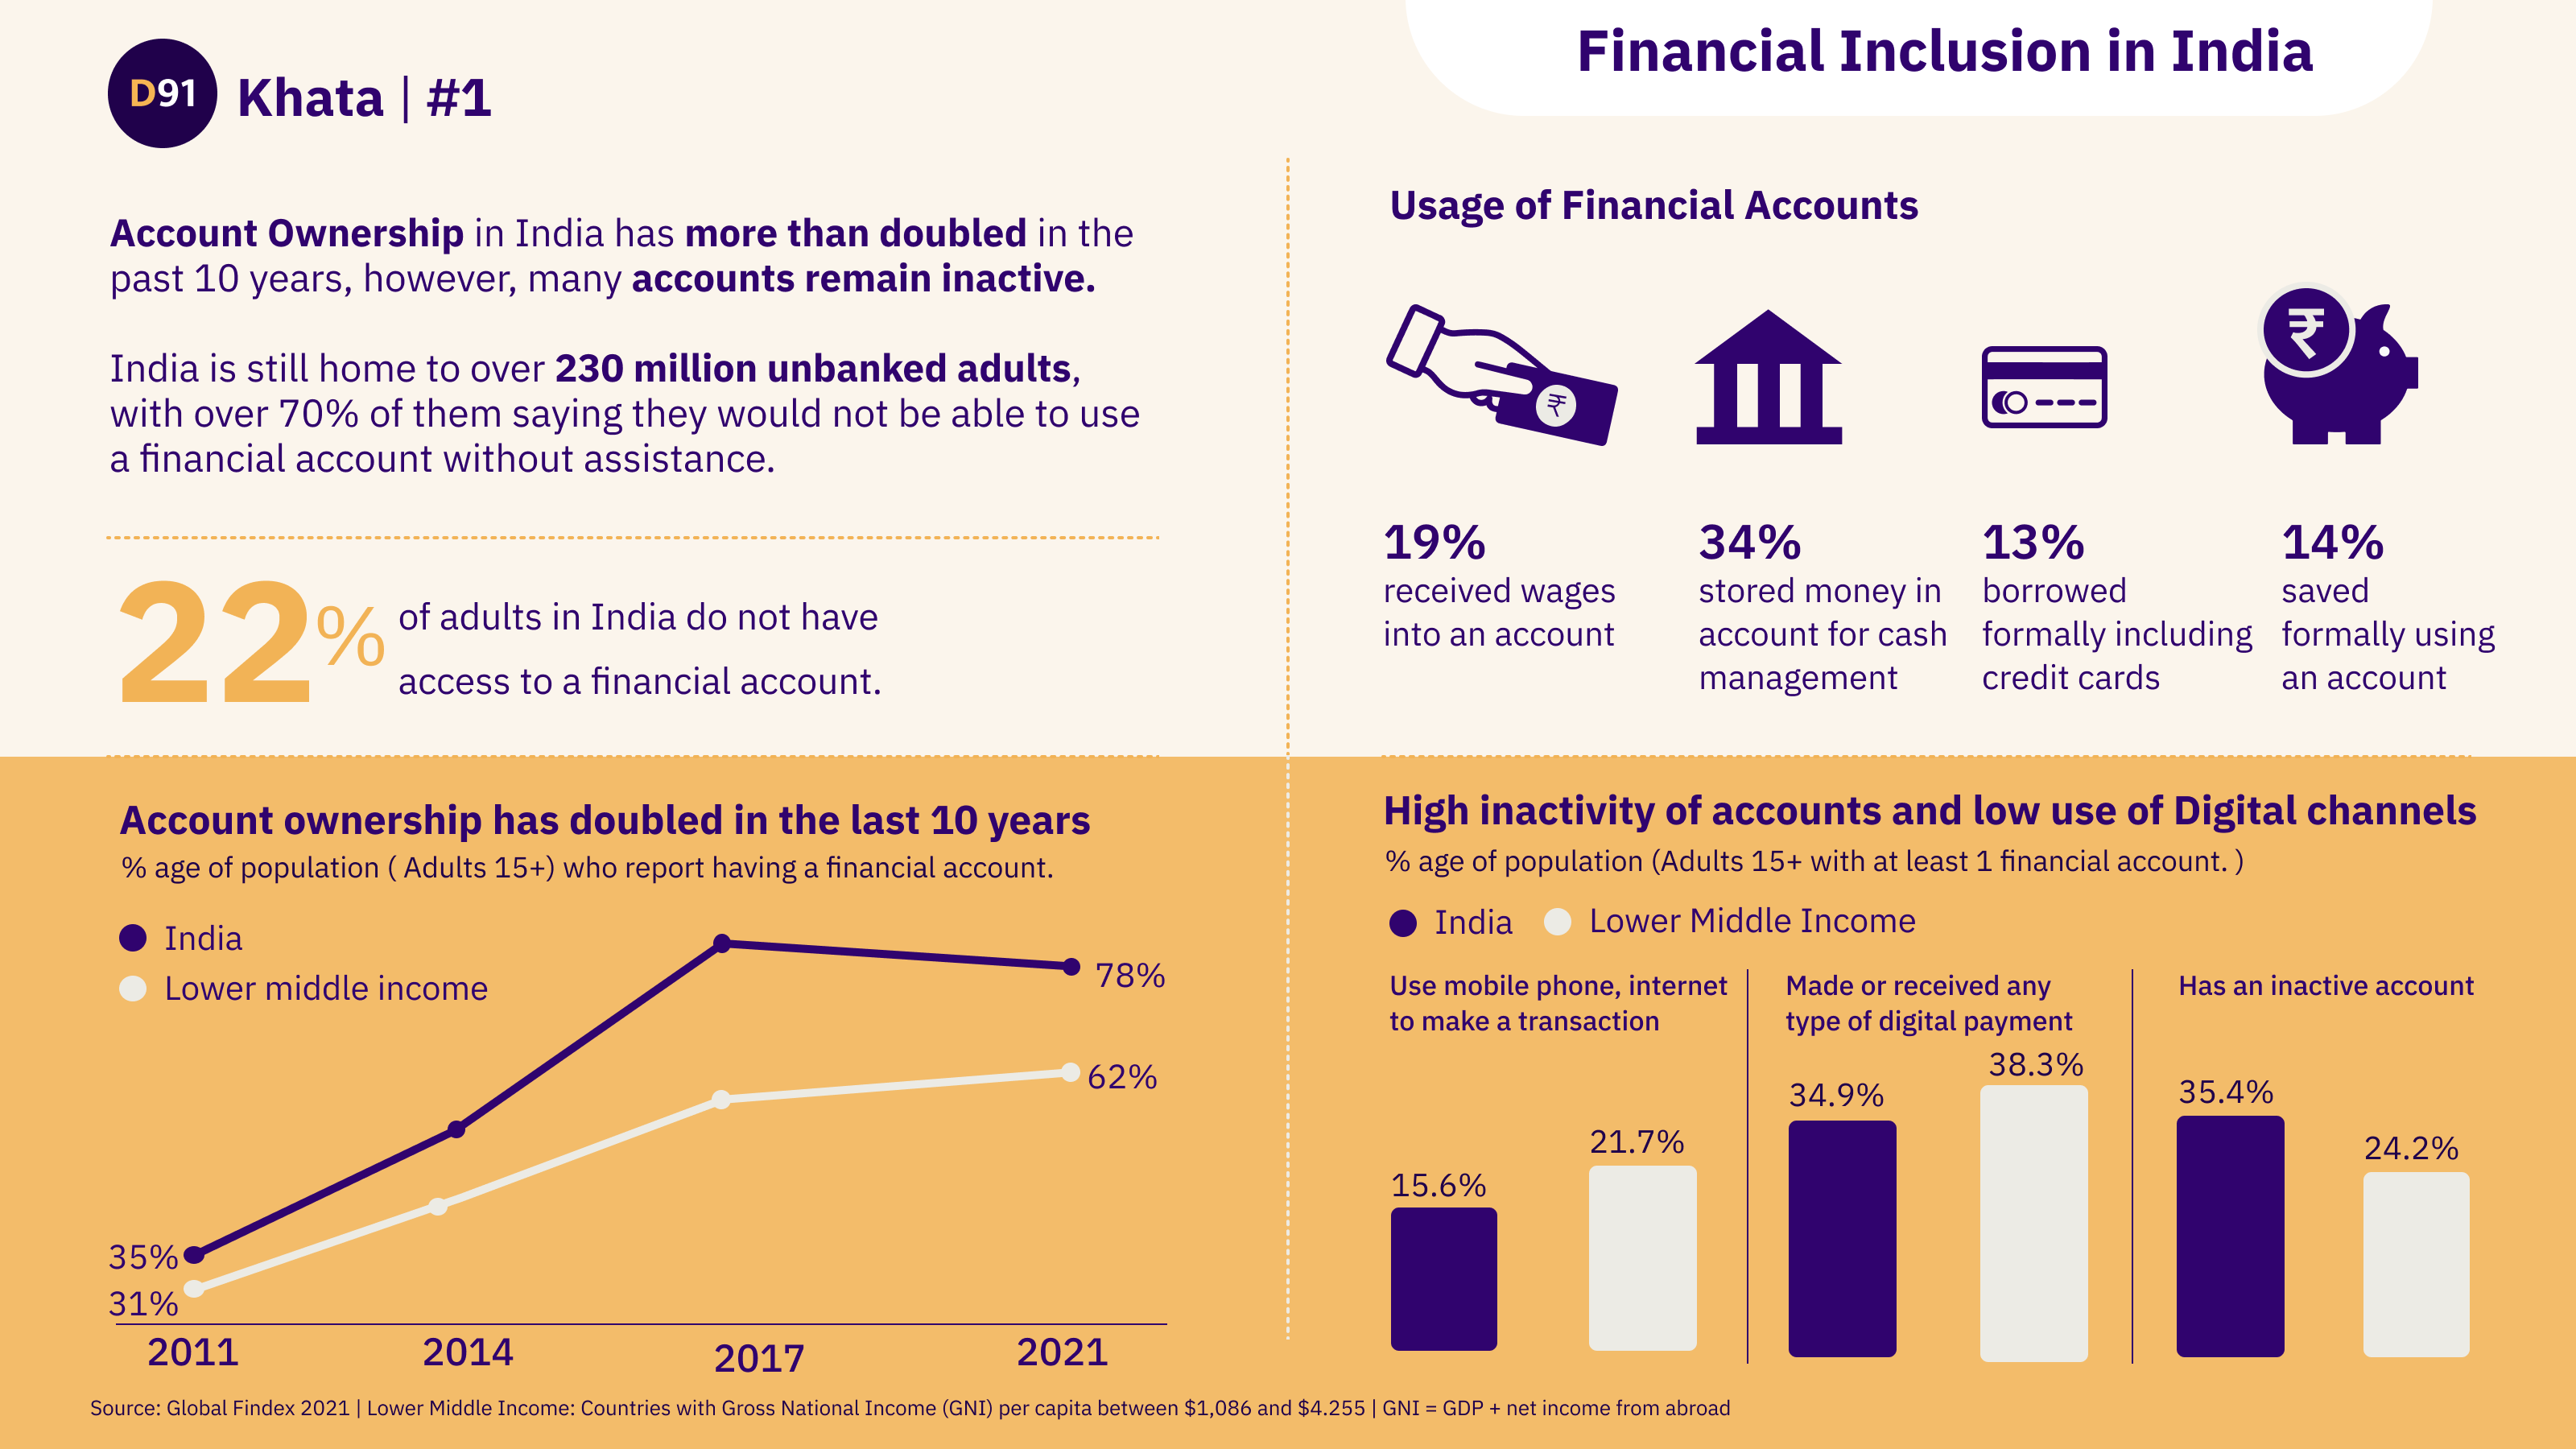
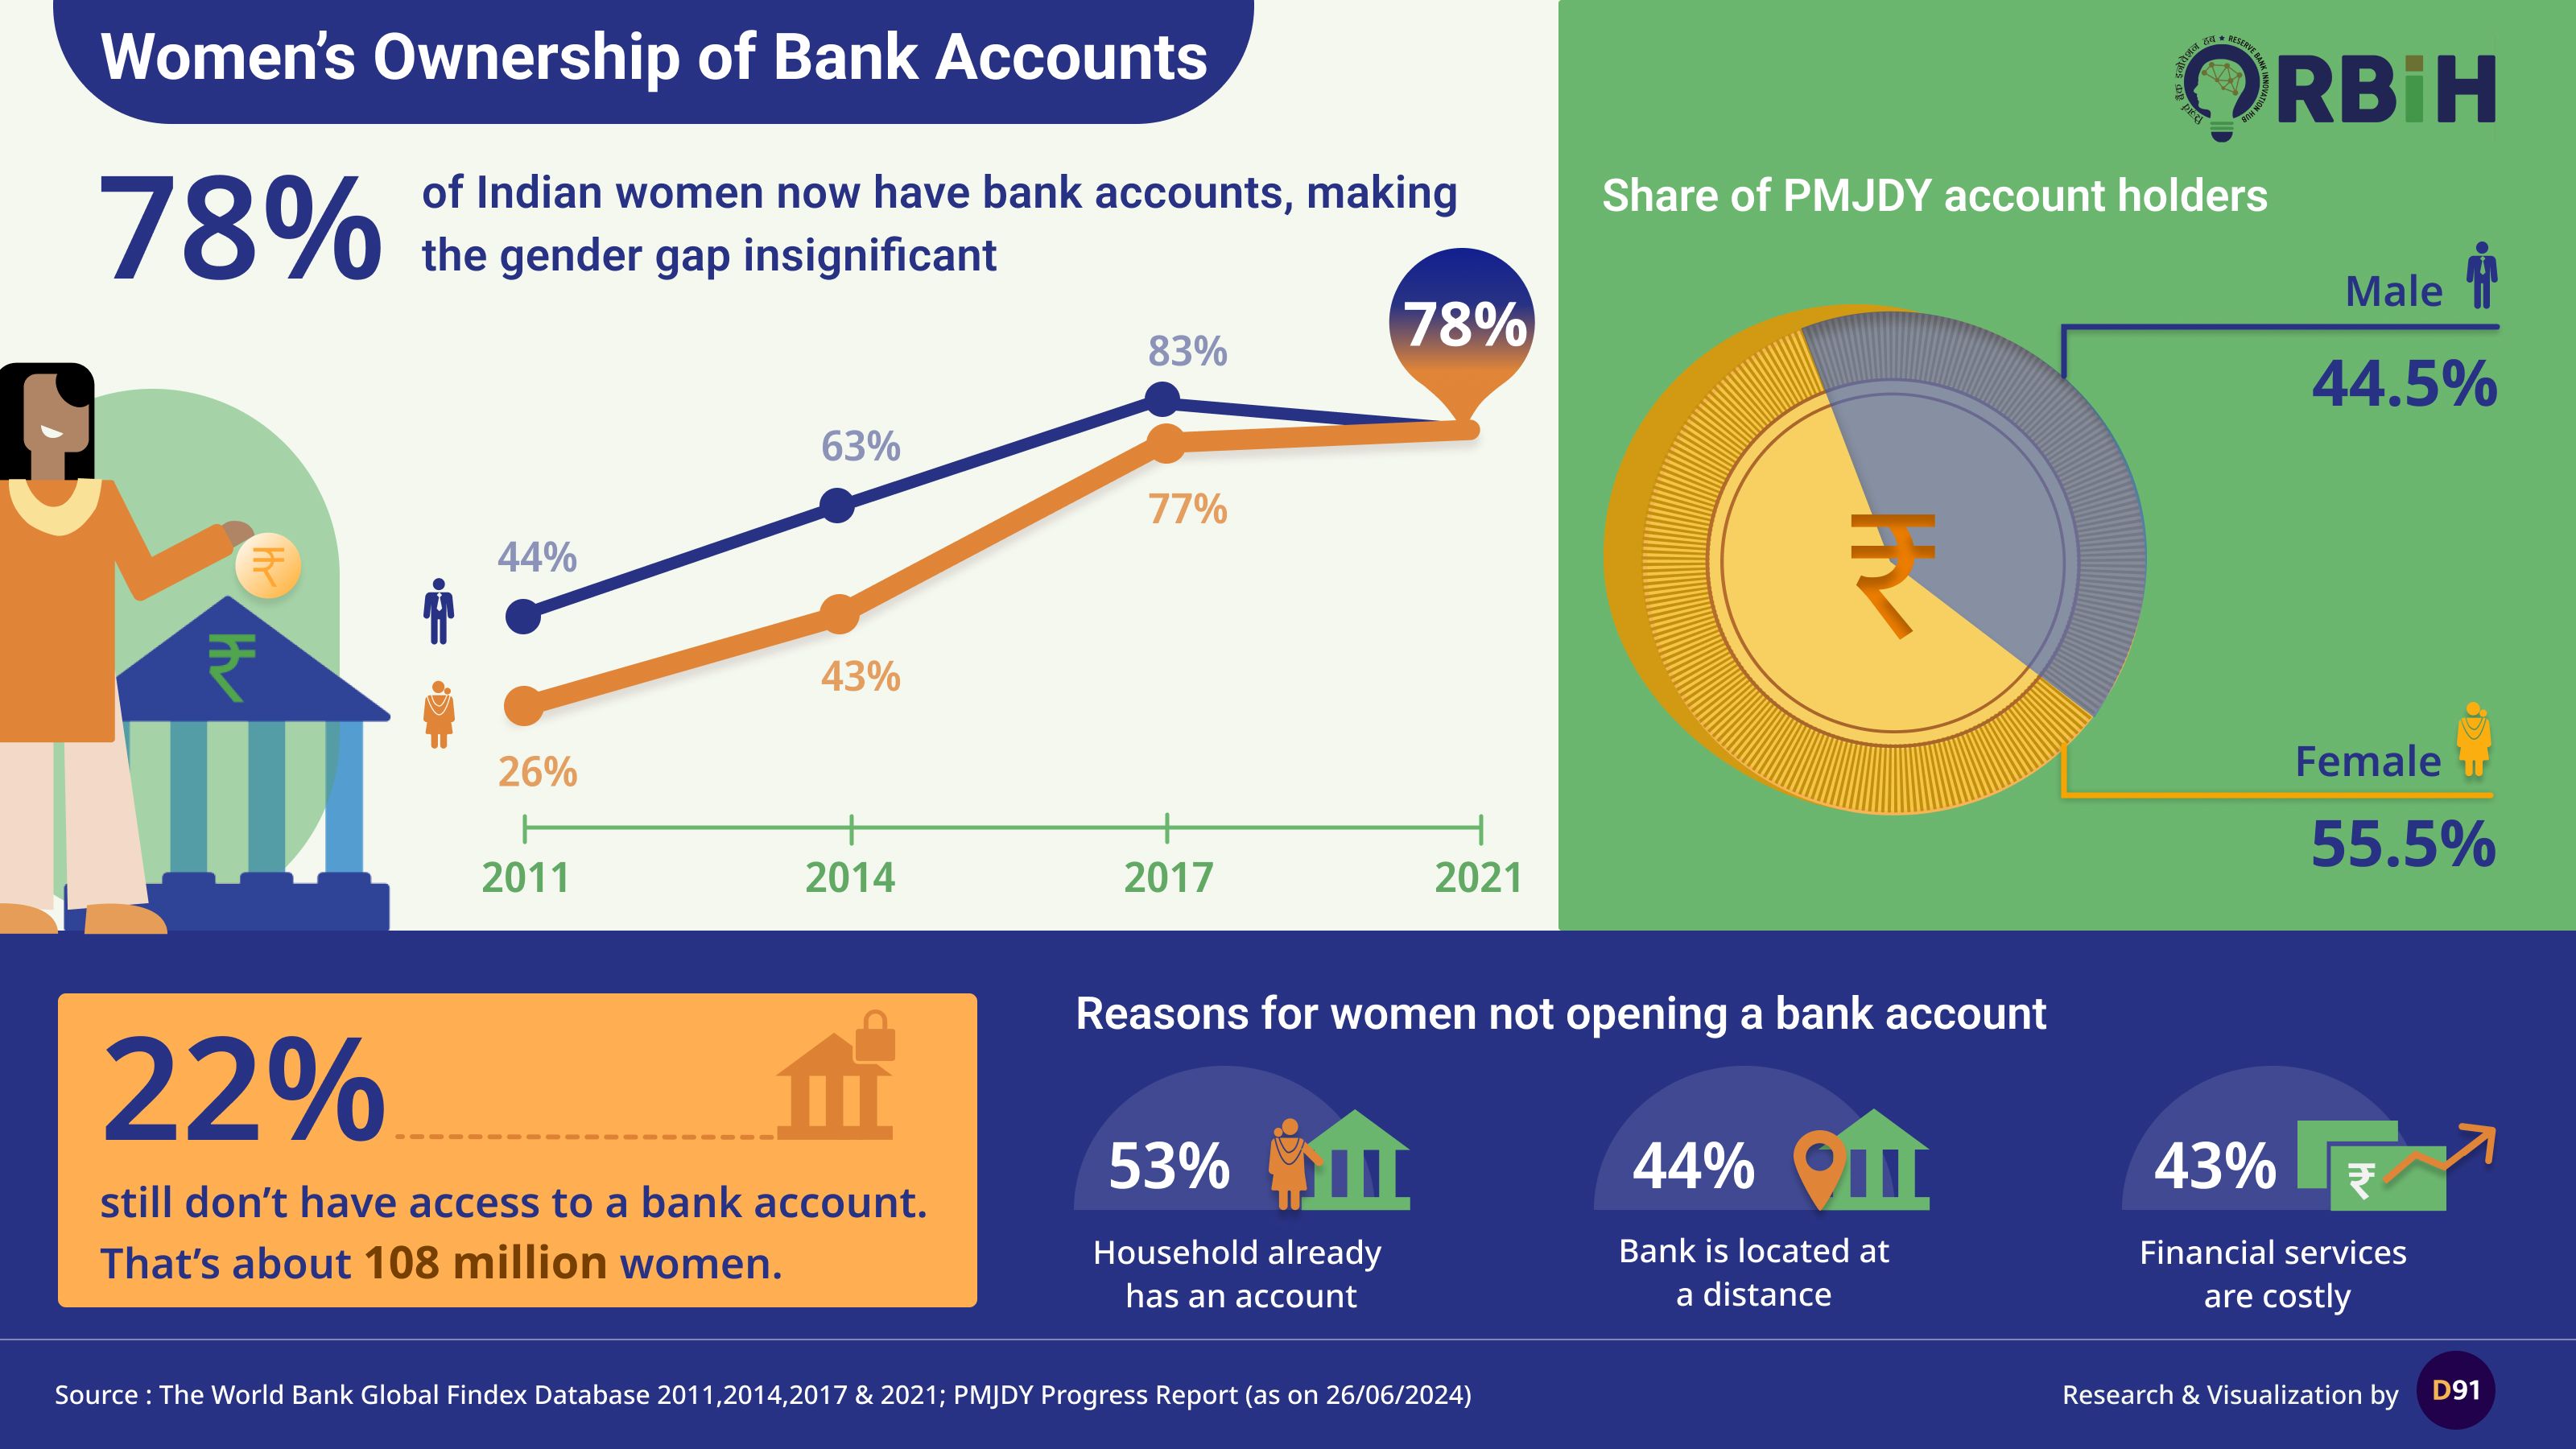
Financial Inclusion in India
Despite India's achievements in Financial Inclusion, there is still a need to design for and tap into the unbanked and underbanked population and bring them into the formal financial net.